As a container orchestration system, Kubernetes relies on the interplay of complex automation mechanisms. Each Kubernetes component provides essential capabilities like service discovery, scaling, or self-healing.
This article provides an overview of how Kubernetes works by exploring its core functionalities.
How Does Kubernetes Work?
Kubernetes is an open-source platform that automates the deployment, scaling, and management of containerized applications. It groups application containers into logical units for easy management and discovery.
The following concepts are essential for understanding how Kubernetes works:
- Node. A worker machine in a Kubernetes cluster. Each node is managed by the control plane and runs the necessary services to support pods.
- Cluster. A distributed system of nodes set up and connected in a way that abstracts underlying infrastructure and enables automation.
- Pod. The smallest deployable unit in Kubernetes. A pod contains one or more containers that share storage, network resources, and a common specification for how to run.
- Deployment. A higher-level abstraction that manages a set of identical pods and ensures that the desired number of pod replicas are running at all times.
- Service. An abstraction that defines a logical set of pods and a policy for accessing them. Services provide a stable IP address and DNS name for accessing a pod, even if the pod is replaced with another version.
- Namespace. A virtual cluster within a physical cluster that allows users to organize and isolate resources.
- Volume. An object that provides storage for pods and allows data to survive container restarts.
Note: Learn more about Kubernetes objects.
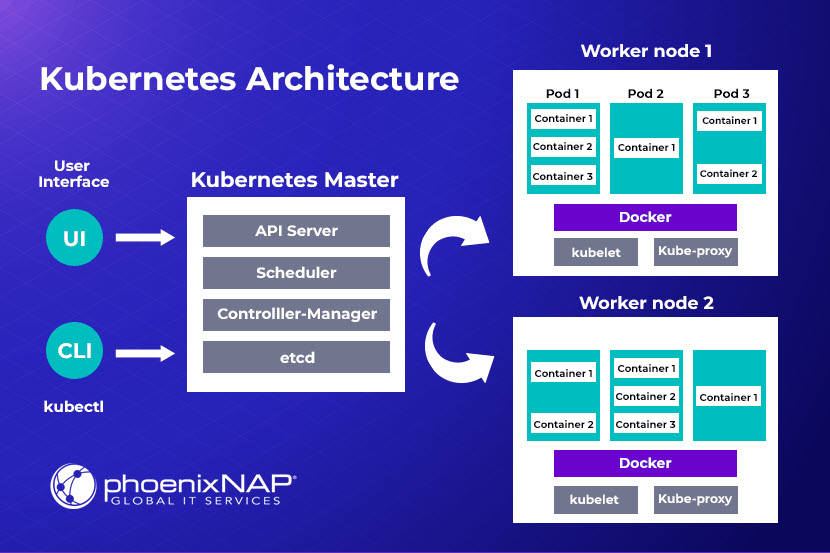
Users access the cluster via the kubectl CLI tool or any available GUI tool (Kubernetes Dashboard, Lens, Rancher, or provider-specific UI tools). The point of contact is the Kubernetes master node, which hosts the following control plane components:
- API server.
- Pod scheduler.
- Controller manager.
- etcd key-value store.
Note: Kubernetes operates on a declarative model. The user defines the desired state of an application, and the system works to achieve and maintain that state.
The API server enables communication with worker nodes, which consist of:
- Application pods.
- Container runtime (e.g., Docker)
- The kubelet pod agent.
- The kube-proxy network proxy.
The following diagram illustrates the Kubernetes architecture:
Kubernetes Networking
Kubernetes provides a consistent and flexible way for communication between:
- Different application parts within a cluster.
- The cluster and the external networks.
The sections below introduce essential networking concepts in Kubernetes.
Networking Model
The networking model featured in Kubernetes closely resembles traditional virtual machine or physical host networking. The platform enforces the following requirements for any networking implementation:
- Pod-to-pod communication without Network Address Translation (NAT). All pods in a cluster must be able to communicate with each other directly using their IP addresses without the need for NAT. Each pod must have a unique, cluster-wide IP address.
- Node-to-pod communication without NAT. All nodes in the cluster must be able to communicate with all pods directly, without NAT.
- Consistent pod IP address. A pod must see its IP address as the same as the IP address it broadcasts to other pods and nodes.
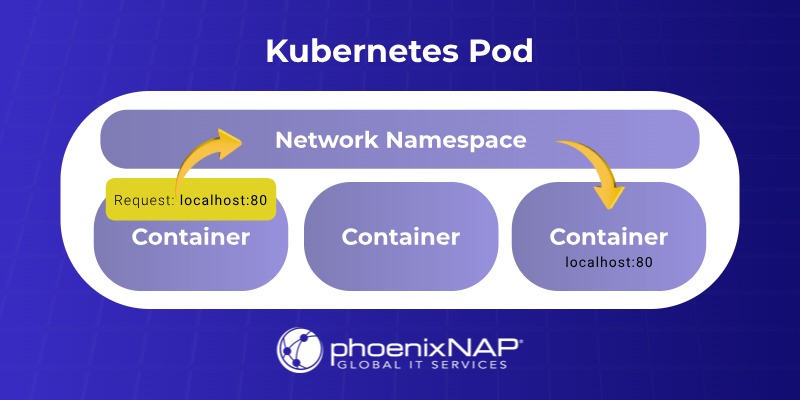
An essential aspect of this model is the IP-per-pod concept, according to which Kubernetes assigns a distinct IP address for each pod. Containers residing within the same pod share the IP address and network namespace, enabling them to communicate with each other via localhost.
To efficiently handle the network operations, Kubernetes utilizes the Container Network Interface (CNI). The interface is between the agent running on each node and various network plugins.
Kubernetes Network Plugins
Kubernetes provides the networking functionality using third-party plugins that implement the CNI specification. CNI plugins are responsible for tasks like pod IP address allocation and seamless inter-pod communication.
Some popular CNI plugins include:
- Flannel. A simple overlay network provider.
- Calico. A networking and network policy provider that supports both overlay and non-overlay networks.
- Cilium. A networking, security, and observability tool that uses eBPF sandboxing technology.
- Weave Net. A resilient and easy-to-configure network fabric.
- Canal. A plugin that combines Flannel for networking and Calico for network policies.
- kube-router. A network and network policy controller.
- OVN-Kubernetes. A networking provider based on Open Virtual Network.
- Multus CNI. A meta-plugin that allows pods to have multiple network interfaces.
Note: The kubectl port-forward command allows access to internal Kubernetes cluster processes from a local machine. Read our Kubernetes Port Forwarding guide to learn how to use the command to connect to a Kubernetes cluster resource.
Kubernetes Service Discovery
Kubernetes service discovery is a mechanism that allows pods and services within the cluster to communicate without knowing the specific IP address or port of their counterpart. It is crucial in a dynamic environment where pods are frequently created, destroyed, and scaled, leading to changes in their IP addresses.
The following sections introduce service discovery mechanisms built into a default Kubernetes deployment.
CoreDNS
Kubernetes primarily uses its internal DNS service (CoreDNS) for service discovery. CoreDNS allows pods to communicate with services using stable DNS names.
When a pod needs to connect with a service, it can look up its DNS name. CoreDNS resolves this name to the cluster IP of the service, and the Kubernetes network proxy (kube-proxy) then forwards the traffic to one of the backend pods associated with the service.
Services' DNS names are provided in the following format:
[service_name].[namespace].svc.[cluster_domain]In the example below, the DNS name of the service named hello in the development namespace (hello.development.svc.cluster.local) shows as the output of the nslookup command:
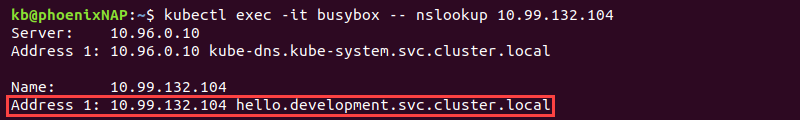
The components making up the name are:
- service_name. The name the user gives to the service.
- namespace. The namespace where the service resides.
- svc. The standard suffix for Kubernetes services.
- cluster_domain. The cluster's domain name (usually cluster.local).
Headless services (services without a cluster IP) do not have DNS names. However, their pods can have DNS records in the format below:
[pod_name].[headless_service_name].[namespace].svc.[cluster_domain]Environment Variables
Environment variables offer a simple but less dynamic alternative for discovering services within the same namespace. Kubernetes automatically injects environment variables into each container running in a pod.
For every service created in the same namespace as the pod, Kubernetes sets environment variables containing information about the service, such as its hostname (which can be used for DNS resolution) and port.
For example, if there is a service named test in the default namespace, a pod in the same namespace has environment variables such as:
TEST_SERVICE_HOST=[test_cluster_ip]
TEST_SERVICE_PORT=[test_port_number]
This method requires pods to be in the same namespace as the service. Furthermore, it only provides the initial set of service-related information, i.e., it does not dynamically update if the service's IP address or port changes.
Kubernetes Services
A Kubernetes service acts as a stable endpoint (Cluster IP and DNS name) for a set of pods. Client applications within the cluster communicate with the service's IP or DNS name.
kube-proxy, running on each node, is responsible for implementing the Service abstraction. It maintains network rules that forward traffic intended for the service's cluster IP to one of the backend pods.
While not a direct discovery mechanism for clients to find individual pod IPs (unless it is a headless service), kube-proxy provides a consistent way to access a group of pods.
Kubernetes Load Balancing
Kubernetes offers load-balancing mechanisms to distribute network traffic across the application pods. They ensure high availability, scalability, and efficient resource utilization.
Load balancing can occur internally and externally. The choice between these mechanisms depends on the following:
- Requirements for internal vs. external access.
- The complexity of routing needs.
- The environment in which the Kubernetes cluster runs.
Note: Production environments often use a combination of services (for internal load balancing and basic external access) and ingress (for advanced external traffic management).
The following sections introduce two main types of load balancing: service and ingress.
Service Level Load Balancing
Services provide internal load balancing in the Kubernetes cluster, enabling pod communication. Below is the list of service types and the related load-balancing mechanisms:
- ClusterIP (default type). Creates a virtual IP address within the Kubernetes cluster. It load balances traffic across the pods selected by the service. This IP address is only accessible from the cluster, and kube-proxy on each node handles the traffic forwarding using iptables or IPVS rules.
- NodePort. Exposes the service on a static port on each node's IP address. External traffic can access the service via the node's IP address and the NodePort. Kubernetes still internally load balances traffic from the NodePort to the backend pods.
- LoadBalancer. Provisions an external load balancer (e.g., provided by the cloud provider) that automatically routes traffic to the service's pods. The cloud load balancer typically has a public IP address. NodePorts are often used as the underlying mechanism for the cloud load balancer to reach the nodes.
Service level load balancing uses the endpoint controller, a control plane component that monitors services and their pod selectors and updates the list of healthy pods. This information is then used by kube-proxy for load balancing.
Ingress Level Load Balancing
Ingress offers a more advanced way to manage external access, providing Layer 7 (OSI model) load balancing and routing to multiple services through a single entry point. It is an API object that acts as a single entry point and can route traffic to different services based on rules defined in the ingress resource (e.g., hostnames, paths).
Kubernetes supports ingress via ingress controller (e.g., Nginx Ingress Controller, Traefik, HAProxy Ingress). The Ingress controller is a specialized load balancer that watches ingress resources and configures an underlying load balancing mechanism (often a reverse proxy) to implement the routing rules.
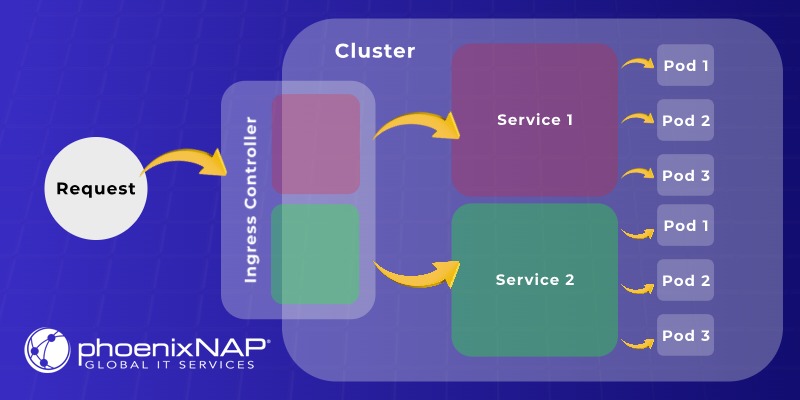
Using ingress can be more cost-effective than creating a dedicated LoadBalancer service for each application, as traffic can be routed to multiple services using a single external IP.
Note: If you need a simple way to test ingress, learn how to set up Kubernetes Ingress with MicroK8s.
Kubernetes Scheduling
The Kubernetes scheduler is a control plane component essential in resource management and overall cluster efficiency. Its primary goal is to find the best node for each newly created pod based on constraints and factors. The Kubernetes scheduler operates continuously, monitoring the state of the cluster and ensuring that pods are placed optimally.
When a user creates a pod (either directly or through a higher-level abstraction like a deployment or stateful set), the Kubernetes API server records this request. The scheduler then observes these newly created, unscheduled pods. For each unscheduled pod, the scheduler goes through a two-phase process: filtering and scoring.
The sections below describe the two phases.
Filtering Phase
In the filtering phase, the scheduler identifies a set of feasible nodes where the pod can be scheduled. This action involves evaluating the pod's requirements against the characteristics and current state of each node.
Factors considered during filtering include:
- Resource requirements. The pod specifies the CPU, memory, and other resources it needs. The scheduler filters out nodes that do not have sufficient available resources to meet these requirements.
- Node selectors and node affinity. Pods specify constraints using node selectors (label-based) and node affinity (more expressive rules). The scheduler filters out nodes that do not match the criteria.
- Taints and tolerations. Taints are key-value pairs associated with an effect (e.g., NoSchedule, PreferNoSchedule, NoExecute). Tolerations allow pods to be scheduled on nodes with matching taints. The scheduler ensures that a pod's tolerations accommodate a node's taints.
- Pod affinity and anti-affinity. Pods express rules about where they should (affinity) or should not (anti-affinity) be scheduled relative to other pods. The scheduler considers these rules to ensure proper placement and improve availability or reduce interference.
- Node pressure. The scheduler considers the current resource pressure on nodes (e.g., memory and disk pressure) to avoid scheduling new pods on overloaded nodes.
Scoring Phase
After the filtering phase, the scheduler has a list of viable nodes. In the scoring phase, the scheduler ranks these feasible nodes to determine the most suitable one for the pod. This procedure involves scoring functions that prioritize nodes based on factors such as:
- Resource utilization. Nodes with lower resource utilization are generally preferred to balance the load across the cluster.
- Node affinity and anti-affinity. Nodes that satisfy affinity rules or avoid anti-affinity rules are typically scored higher.
- Taint and toleration preferences. While tolerations allow a pod to run on a tainted node, there might be preferences for Nodes without certain taints.
- Pods across failure domains. To improve resilience, the scheduler can prioritize spreading pods of a replica set or deployment across different availability zones or failure domains.
- Custom scheduling policies. Kubernetes allows for the implementation of custom schedulers or scheduling plugins to tailor the scheduling process to specific workload requirements.
Once all the scoring functions have been applied, the node with the highest total score is selected, and the scheduler binds the pod to the node. The binding is recorded in the Kubernetes API, and the kubelet on the chosen node is responsible for pulling the container image(s) and starting the containers defined in the pod specification.
Note: The Kubernetes CronJob controller automates the creation of jobs based on a recurring schedule. Using the Cron syntax from Linux, the controller enables time-based execution of tasks. Read more in our Kubernetes CronJob Guide.
Kubernetes Autoscaling
Kubernetes autoscaling allows clusters to adjust their resources (number of nodes or the resources allocated to pods) in response to workload demands. It ensures that applications have the necessary resources to perform optimally and cost-effectively, scaling up during peak times and down during periods of low activity.
There are three primary types of autoscaling in Kubernetes:
- Horizontal Pod Autoscaler (HPA).
- Vertical Pod Autoscaler (VPA).
- Cluster Autoscaler (CA).
The sections below contain descriptions of each type.
Horizontal Pod Autoscaler (HPA)
Kubernetes HPA automatically adjusts the number of pod replicas in a deployment, replication controller, stateful set, or replica set based on observed metrics such as CPU, memory, or custom metrics. It periodically queries metrics from the Kubernetes metrics server or custom metrics APIs.
Based on the defined target utilization, HPA calculates the desired number of replicas and scales the workload up or down. For example, the following YAML manifest describes an HPA object named hpa-test:
apiVersion: autoscaling/v1
kind: HorizontalPodAutoscaler
metadata:
  name: hpa-test
spec:
  scaleTargetRef:
    apiVersion: apps/v1
    kind: Deployment
    name: hpa-test
  minReplicas: 1
  maxReplicas: 10
  targetCPUUtilizationPercentage: 50
The object sets the minimum number of replicas to one and the maximum to ten. It also monitors CPU utilization and strives to maintain it at 50 percent.
HPA improves application performance during traffic spikes, enables efficient resource utilization during low traffic, and ensures high availability. It is ideal for stateless applications (web servers, API gateways, and application frontends) where increasing the number of replicas can handle increased traffic or workload.
Vertical Pod Autoscaler (VPA)
VPA automatically adjusts the CPU and memory requests and limits of individual pods to optimize resource utilization and cost efficiency. It consists of three components:
- Recommender. Analyzes historical and current resource usage of pods and provides recommendations for CPU and memory requests and limits.
- Updater. Works in two modes:
- Auto mode updates the pod specifications directly. It requires restarting the pods.
- Off mode provides recommendations for manual updates.
- Admission Controller. Modifies the resource requests of new pods based on the VPA recommendations.
VPA is suitable for stateful applications or applications where horizontal scaling is not the most effective approach.
Warning: VPA should not be used with HPA on the same resource based on CPU or memory metrics, as they might conflict.
Cluster Autoscaler (CA)
CA automatically adjusts the number of nodes in the Kubernetes cluster based on the resource needs of the pods. It uses the following criteria:
- If there are pending pods and adding a node allows them to be scheduled, CA provisions a new node.
- If nodes are underutilized for an extended period, CA removes them to save costs.
The system ensures that the cluster has enough capacity to run the required pods, optimizes cloud costs by removing unnecessary nodes, and reduces the need for manually scaling the cluster size. It is essential for managing the underlying infrastructure of the Kubernetes cluster, especially in cloud environments where nodes can be dynamically provisioned and de-provisioned.
Kubernetes Storage Management
Storage management is critical to running stateful applications in a containerized environment. It involves managing persistent pod storage and ensuring data availability even when pods are restarted, rescheduled, or scaled.
The sections below introduce the key concepts and mechanisms of Kubernetes storage management.
Persistent Volumes (PVs)
Persistent volumes are cluster-level resources representing a piece of storage provisioned by an administrator or dynamically provisioned using storage classes. They have a lifecycle independent of any individual pod and persist data beyond the pod lifespan.
PVs are defined as API objects with:
- A specific capacity.
- Access modes (e.g., ReadWriteOnce, ReadOnlyMany, ReadWriteMany).
- Reclaim policies (Retain, Delete, Recycle).
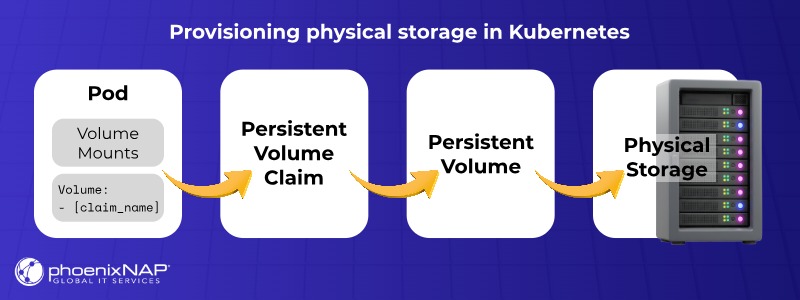
Persistent Volume Claims (PVCs)
PVCs are objects that abstract the complexities of backend storage volumes, allowing users to request storage resources without detailed knowledge of the underlying cloud environment. While administrators define the full claim details in the PVC, pods only require a link to access it, effectively adding layers of abstraction between pods and storage.
The user specifies a volume claim in a YAML file describing a deployment. The claim is used to reserve a persistent volume, which represents a pre-specified amount of physical storage.
Storage Classes
Storage classes provide a way for administrators to describe the storage they offer. They simplify storage management by abstracting the underlying storage infrastructure.
Storage classes also enable dynamic provisioning of persistent volumes. When a PVC requests storage from a storage class, Kubernetes automatically provisions a corresponding PV using a class-defined provisioner (e.g., cloud provider block storage, NFS).
Note: Read our article on Kubernetes best practices to learn how to build optimized containers, streamline deployments, and administer reliable services.
Kubernetes Security
Kubernetes security is a multi-layered field that protects containerized applications and the Kubernetes infrastructure, encompassing the control plane (API server, etcd), worker nodes, network, and applications.
Key security best practices and strategies include:
- Role-based access control (RBAC). Implement granular permissions for users and services.
- Network policies. Control traffic between pods and namespaces to limit lateral movement.
- Kubernetes secrets. Securely store and access sensitive information.
- Pod security admission (PSA): Enforce pod security standards at the namespace level.
- Secure container images. Use minimal base images, scan for vulnerabilities, and sign images.
- Security contexts. Configure pod and container privileges (user, group, capabilities, seccomp).
- Network segmentation. Isolate workloads using namespaces and network policies.
- API server security. Secure access via TLS, authentication, and authorization.
- etcd security. Protect the cluster's data store with TLS and access controls.
- Audit logging. Track API server activity for monitoring and forensics.
- Regular updates. Keep Kubernetes components up-to-date with security patches.
Kubernetes Monitoring and Logging
Kubernetes monitoring and logging are essential for understanding the health and performance of a cluster and its applications. They provide insights that help debug issues, optimize resource utilization, and ensure the stability of a Kubernetes environment.
Monitoring involves collecting and analyzing cluster and app-related metrics such as:
- Resource utilization (CPU load, memory pressure, disk I/O, and network traffic).
- Application performance (request latency, error rates, throughput, and custom business metrics).
- The health of Kubernetes components (API server, etcd, scheduler, controller manager, and kubelets).
Logging refers to collecting, processing, storing, and analyzing log data generated by Kubernetes components and applications. Effective logging is essential for debugging, auditing, and understanding system events.
There are three main types of logging:
- Application logging. Applications running in containers write logs to standard output (stdout) and standard error (stderr). A container runtime (e.g., Docker, containerd) intercepts these streams.
- Node-level logging. By default, the kubelet on each node handles redirecting container logs to the local filesystem (typically /var/log/containers/).
- Cluster-level logging. This type of logging enables robust and centralized log management. Cluster-level logging involves:
- Having log collection agents running on each node (or as DaemonSets) to collect logs from the container runtime or application log files.
- Processing and filtering logs before sending them to a central storage system.
- Storage backend to store the collected logs.
- Querying, analyzing, and visualizing logs.
Monitoring Tools
Kubernetes monitoring tools provide insights into the performance and health of Kubernetes clusters. They collect and analyze metrics to help users identify issues and optimize resource usage.
The most popular tools include:
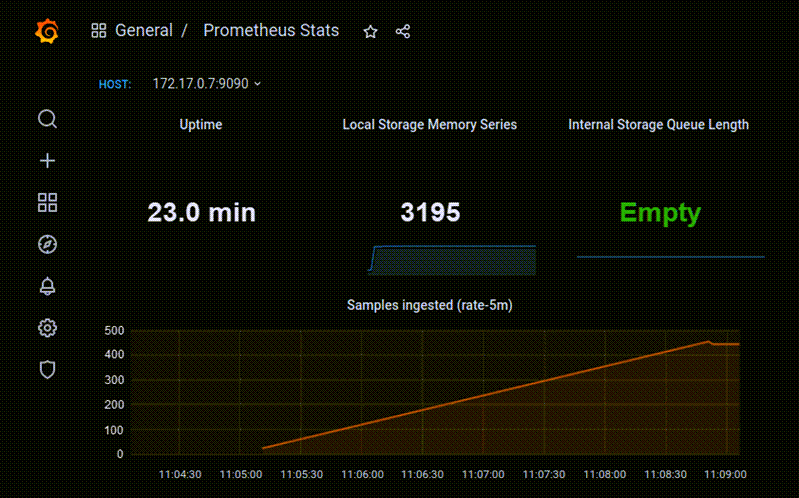
- Prometheus. A widely adopted open-source monitoring and alerting system that scrapes metrics from configured targets.
- Grafana. A popular open-source data visualization and dashboarding tool that integrates well with Prometheus and other data sources.
- cAdvisor. An open-source agent that collects resource usage and performance metrics from containers. It is often integrated into the kubelet.
- kube-state-metrics. A simple service that listens to the Kubernetes API server and generates metrics about the state of Kubernetes objects (deployments, pods, etc.).
- Node Exporter. A Prometheus exporter that exposes hardware and OS metrics from Linux nodes.
- Alertmanager. Handles alerts Prometheus sends and manages their routing, grouping, and silencing.
- OpenTelemetry. An open-source observability framework for generating, collecting, and exporting telemetry data (metrics, logs, and traces).
- Cloud provider monitoring services like AWS CloudWatch, Google Cloud Monitoring, and Azure Monitor.
- Third-party monitoring solutions like Datadog, New Relic, and Dynatrace.
Logging Tools
Kubernetes logging tools serve to aggregate, manage, and analyze log data generated by applications and the Kubernetes system. They enable efficient troubleshooting, auditing, and understanding of application behavior.
Below are some of the essential logging tools:
- Fluentd and Fluent Bit. Open-source data collectors and processors that gather logs from various sources and forward them to various backends. Fluent Bit is lightweight and often used as a log forwarder.
- Elasticsearch, Fluentd, Kibana (EFK Stack). Fluentd works well with Elasticsearch (a search and analytics engine) and Kibana (a visualization tool). Together, they make up a popular open-source stack for centralized logging.
- Loki and Promtail. An open-source log aggregation system inspired by Prometheus. Promtail is the agent that collects logs and sends them to Loki, which indexes logs by labels. Grafana is commonly used for visualization.
- Cloud provider logging services like AWS CloudWatch Logs, Google Cloud Logging, and Azure Monitor Logs.
- Third-party logging solutions like Datadog, Splunk, and Sumo Logic.
Conclusion
After reading this article, you should have a foundational understanding of the Kubernetes architectural elements and operational principles. The article detailed essential Kubernetes functionalities like service discovery, load balancing, scheduling, and autoscaling.
If you need a simpler solution for container orchestration, read Nomad vs. Kubernetes and learn more about Nomad, a lightweight container orchestrator and scheduler.