The ELK Stack natively integrates with Kubernetes, where it serves as a monitoring stack – it collects, stores, and analyzes k8 telemetry data. There are several methods for setting up and deploying the ELK stack on Kubernetes, and using helm charts is the most straightforward one.
In this tutorial, you will learn how to utilize a helm chart to install Elasticsearch, the main component of the ELK stack, as well as Kibana and Metricbeat (in place of Logstash), on your Kubernetes cluster.

Prerequisites
- A Kubernetes cluster (you can create it with minikube)
- kubectl command-line tool installed
- Helm package manager installed
Set up Kubernetes Cluster for Elasticsearch
1. First, start Minikube. A multi-node cluster for Elasticsearch requires significant system resources, so make sure you allocate enough CPUs and memory using the --cpus and --memory options:
minikube start --cpus 4 --memory 8192
Important: If you ran a Minikube cluster on the same system before, you cannot use the above-mentioned options to allocate resources. To start a new cluster, use the minicube delete command to remove the previous cluster and then proceed with the instructions.
2. Check if your cluster is functioning properly by typing:
kubectl cluster-infoThe output confirms that the Kubernetes control plane and KubeDNS are running:

Deploy Elasticsearch with Helm
Note: This tutorial uses Helm version 3.4.1 command syntax. If you are using Helm 2, the commands may differ.
1. To start installing Elasticsearch, add the elastic repository in Helm:
helm repo add elastic https://helm.elastic.co
2. Now, use the curl command to download the values.yaml file containing configuration information:
curl -O https://raw.githubusercontent.com/elastic/helm-charts/master/elasticsearch/examples/minikube/values.yaml
3. Use the helm install command and the values.yaml file to install the Elasticsearch helm chart:
helm install elasticsearch elastic/elasticsearch -f ./values.yamlThe -f option allows specifying the yaml file with the template. If you wish to install Elasticsearch in a specific namespace, add the -n option followed by the name of the namespace.
helm install elasticsearch elastic/elasticsearch -n [namespace] -f ./values.yamlThe output confirms the status of the app as deployed and offers additional options to test the installation:

4. The first option is to use the get pods command to check if the cluster members are up:
kubectl get pods --namespace=default -l app=elasticsearch-master -wOnce the READY column in the output is entirely populated with 1/1 entries, all the cluster members are up:

The other option is to use the helm test command to examine the cluster’s health:
helm test elasticsearch
5. Once you successfully installed Elasticsearch, use the kubectl port-forward command to forward it to port 9200:
kubectl port-forward svc/elasticsearch-master 9200
To keep using the terminal after executing the port-forward command, run the command in another terminal window.
Note: If you are looking for a different method, refer to our guide on deploying Elasticsearch on Kubernetes manually.
Install Kibana
1. To install Kibana on top of Elasticsearch, type the following command:
helm install kibana elastic/kibanaThe output confirms the deployment of Kibana:

2. Check if all the pods are ready:
kubectl get podsKibana pod appears underneath the Elasticsearch pods:

3. Forward Kibana to port 5601 using kubectl:
kubectl port-forward deployment/kibana-kibana 5601
4. After you set up port-forwarding, access Elasticsearch, and the Kibana GUI by typing http://localhost:5601 in your browser:

Note: Refer to our complete Kibana tutorial to learn how to query and visualize data.
Install Metricbeat
Installing Metricbeat follows the same pattern as installing Kibana.
1. Use Helm to issue the install command:
helm install metricbeat elastic/metricbeat
2. Confirm that the Metricbeat pods are up and running:
kubectl get pods
3. To see Elasticsearch metric indexing, use the curl command:
curl localhost:9200/_cat/indices
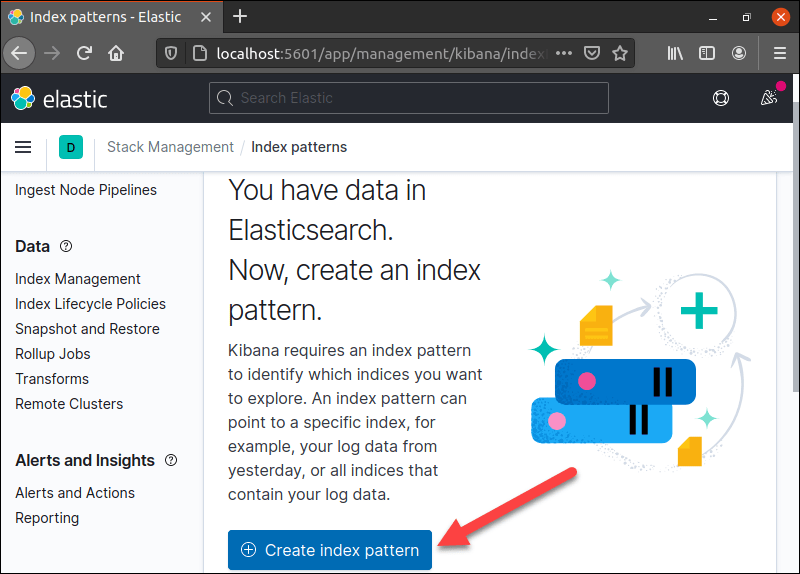
4. Visit Kibana. You will now be able to create an index pattern. Navigate to Stack Management > Index patterns:

5. Click the Create Index Pattern button to start working with Kibana.
Conclusion
After following this tutorial, you should know how to install Elasticsearch, Kibana, and Metricbeat in Kubernetes using the helm chart.
The ELK stack can also be deployed outside of Kubernetes. If you want to know more about this topic, read how to install ELK stack on Ubuntu.


