Kibana is a powerful visualization and querying platform and the primary visual component in the ELK stack. The tool has a clean user interface with many useful features to query, visualize and turn data into practical information.
This tutorial provides examples and explanations on querying and visualizing data in Kibana.

Prerequisites
- Kibana deployed and configured.
- Sample Kibana data for web traffic.
- Browser to access the Kibana dashboard.
What Is Kibana?
Kibana is a browser-based visualization, exploration, and analysis platform. Together with Elasticsearch and Logstash, Kibana is a crucial component of the Elastic stack. The intuitive user interface helps create indexed Elasticsearch data into diagrams through various plots, charts, graphs, and maps.
What Is Kibana Used For?
Kibana is a tool for querying and analyzing semi-structured log data in large volumes. In the ELK stack, Kibana serves as the web interface for data stored in Elasticsearch.
Some use cases include:
- Real-time analysis of website traffic.
- Sensory data analysis and monitoring.
- Sales statistics for ecommerce websites.
- Email delivery monitor.
Besides visualization, analysis, and data exploration, Kibana provides a user interface for managing Elasticsearch authorization and authentication.
Note: Deploy an Ubuntu powered Bare Metal Cloud instance in under two minutes and provide a perfect platform for your ELK monitoring stack. The high availability servers go for as low as $0.10/h.
To install the ELK stack on your Ubuntu BMC instance, follow our tutorial: How to Install ELK Stack on Ubuntu 18.04 / 20.04.
Kibana Features
Kibana has many exciting features. Some more notable features are outlined in the table below.
| Feature | Description |
|---|---|
| Visualization | Core Kibana features classic graphing interfaces: pie charts, histograms, line graphs, etc. |
| Dashboard | Piecing together various visualization on one dashboard pane creates a more straightforward data overview. |
| Generating and Sharing Reports | Generating CSV tables, embedding visualizations, and sharing via URL. |
| Searching and Filtering | Data filtering and queries using the intuitive Kibana Query Language (KQL). |
| Plugins | Additional visualization and UI tools, such as 3D graphs, calendar visualization, and Prometheus exporter are available through plugins. |
| Geospatial Analysis | Visualizing spatial data provides a realistic location view. |
| Time Series Analysis | Visual builder for time series data analysis with aggregation. |
| Canvas | Fully customizable colors, shapes, texts, and queries for dynamic presentations. |
Kibana Index Pattern
Index patterns are how Elasticsearch communicates with Kibana. A defined index pattern tells Kibana which data from Elasticsearch to retrieve and use. Add an index pattern by following these steps:
1. The search bar at the top of the page helps locate options in Kibana. Press CTRL+/ or click the search bar to start searching.
2. Type Index Patterns. Press Enter to select the search result.
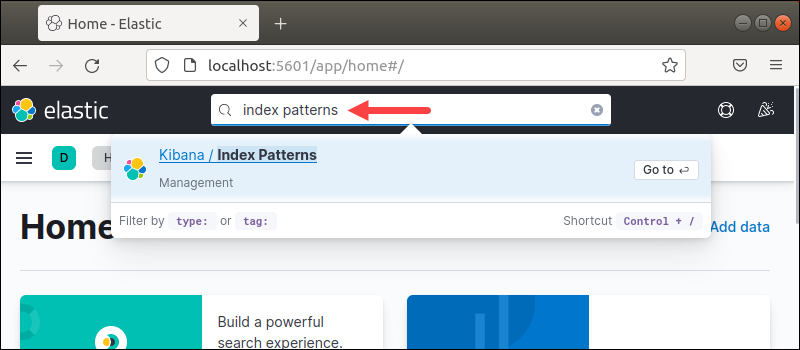
The search is not case-sensitive.
3. The Index Patterns page opens. Click Create index pattern to create an index pattern.

4. To define the index pattern, search for the index you want to add by exact name. Use an asterisk (*) for a close match or to match multiple indexes with a similar name.
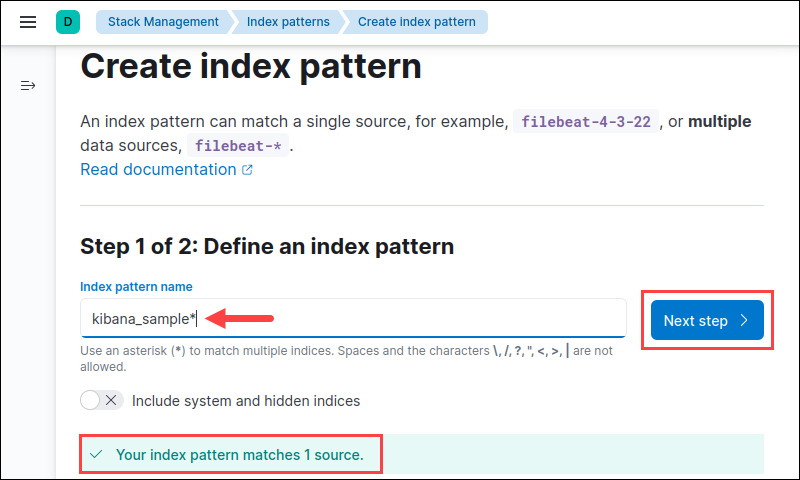
If you're unsure about the index name, available index patterns are listed at the bottom. We're using the Kibana sample web traffic data for the tutorial. Click Next step to continue.
5. If the data has an index with a timestamp, specify the default time field for filtering the data by time. Select the appropriate option from the dropdown menu.
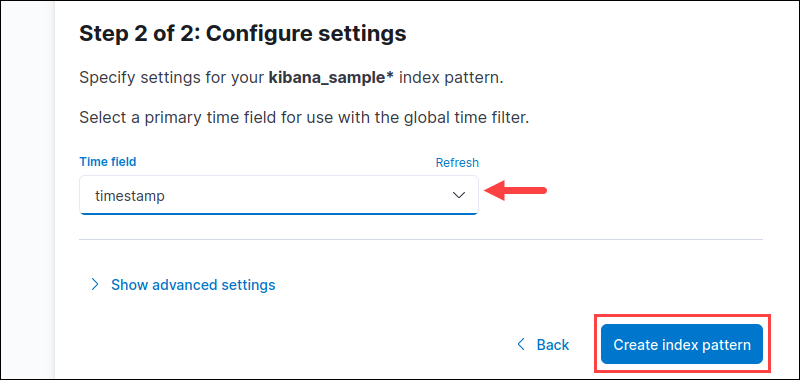
Alternatively, select the I don't want to use the time filter option if you do not have time data or merge time fields. Press the Create index pattern button to finish.
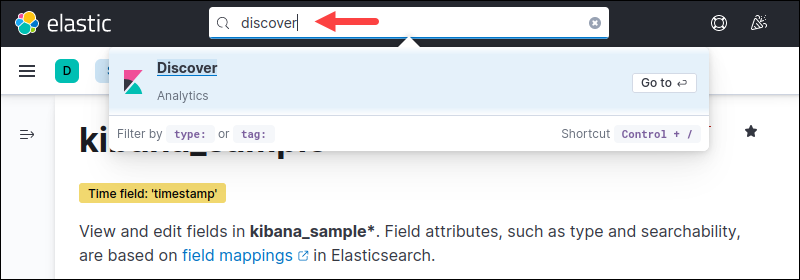
6. To explore the data, type Discover in the search bar (CTRL+/) and press Enter.
7. Select the index pattern from the dropdown menu on the left pane.
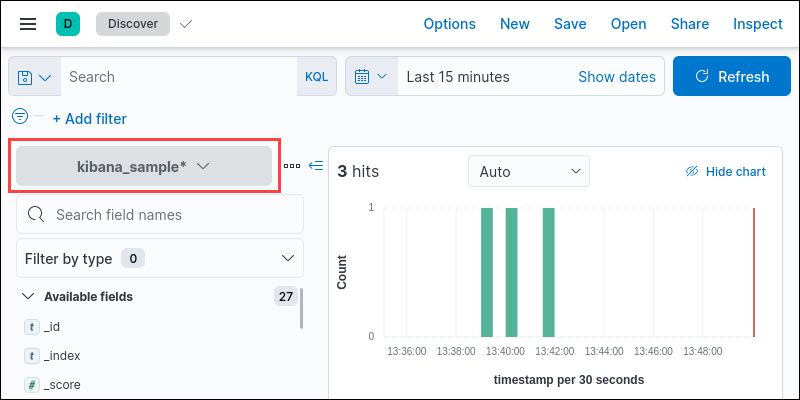
The discover page shows the data from the created index pattern.
Kibana Search
Kibana offers various methods to perform queries on the data. Clicking the search field provides suggestion and autocomplete options, which makes the learning curve smoother. Save the code for later use in visualization.
Below are the most common ways to search through the information, along with the best practices.
KQL and Lucene
Version 6.2 and previous versions used Lucene to query data. Newer versions added the option to use the Kuery or KQL language to improve searching. The 7.0 and more recent versions use KQL by default and offer the choice to revert to Lucene.
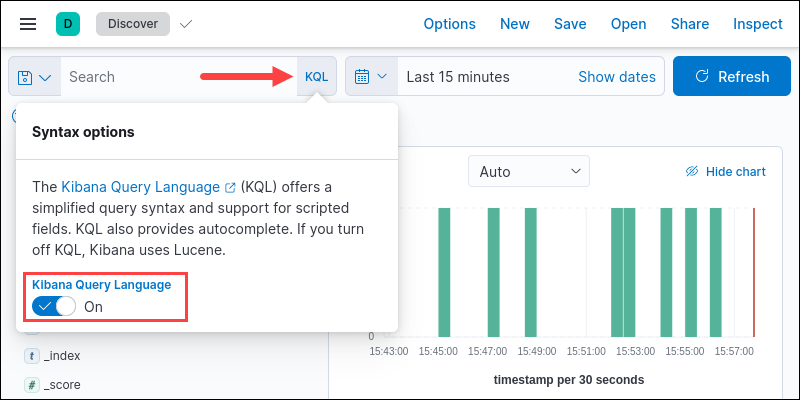
To change the language to Lucene, click the KQL button in the search bar. Change the Kibana Query Language option to Off.
Text Search
Use the search box without any fields or local statements to perform a free text search in all the available data fields.
If no data shows up, try expanding the time field next to the search box to capture a broader range.
Single Word Query
Searching for the word elasticsearch finds all instances in the data in all fields.
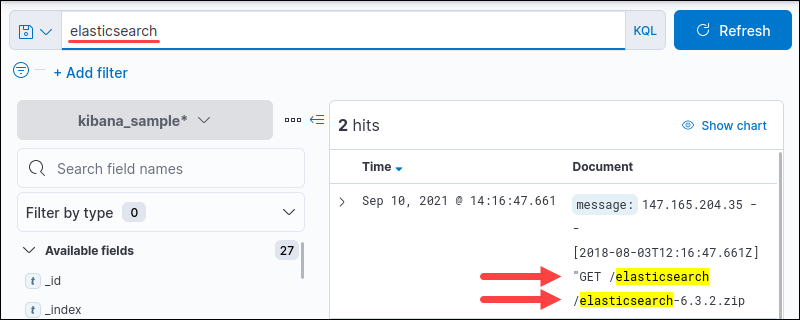
The query in Kibana is not case-sensitive. Use the asterisk sign (*) for a fuzzy string search.
Multiword Query
Hit the space bar to separate words and query multiple individual terms.
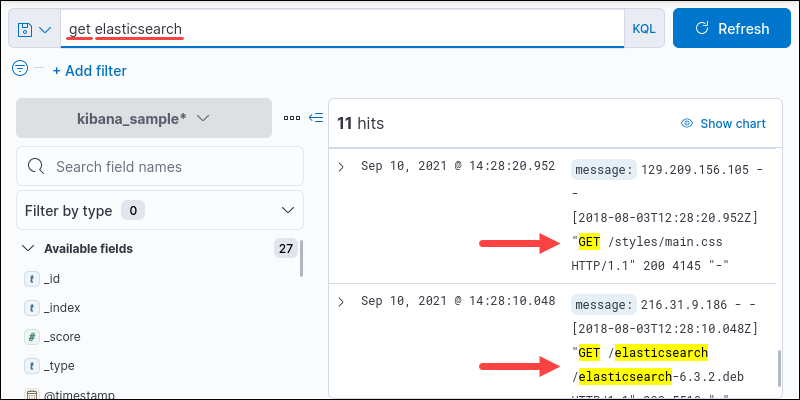
For example, get elasticsearch locates elasticsearch and get as separate words.
String Query
To match an exact string, use quotation marks.
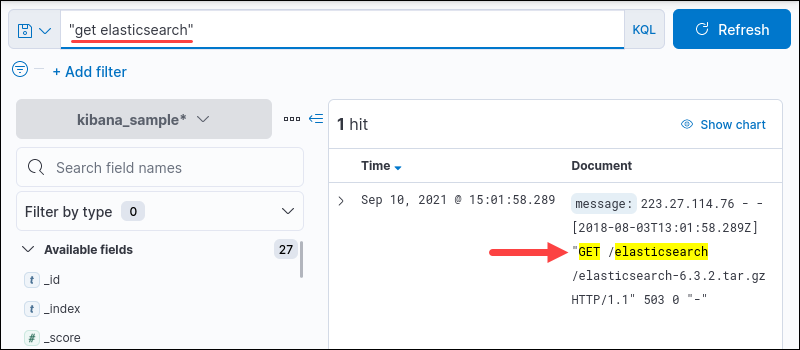
For example, "get elasticsearch" queries the whole string.
Field Search
Kibana allows searching individual fields. Check all available fields on the bottom left menu pane under Available fields:
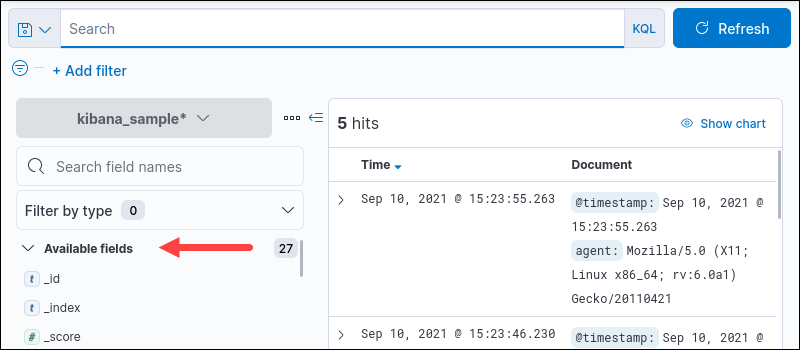
To perform a search in a specific field, use the following syntax:
<field name> : <query>The query syntax depends on the field type.
Search Field for Exact Phrase
For example, search the response.keyword field for the "404" message response:
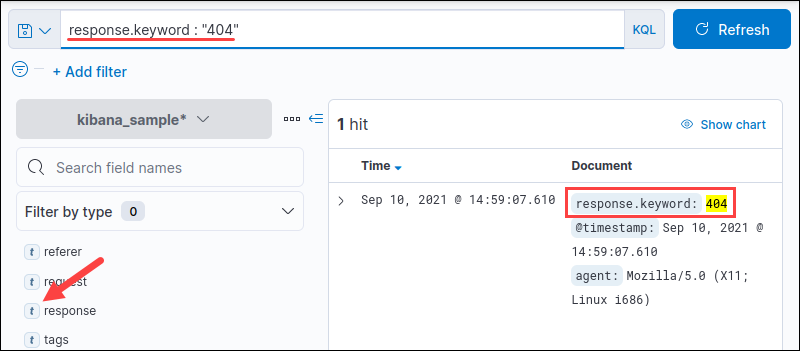
The output shows all matched instances in the specified field. Search multiple values by separating the query terms with a space:
response.keyword : 404 200Notice the field type is set as t, indicating the field is text type.
Search Field Range
Numeric and date types often require a range. KQL supports four range operators.
- Greater than (>).
- Less than (<).
- Greater than or equal to (>=).
- Less than or equal to (<=).
For example, search for a date range:
@timestamp <= "2021-09-02"
The output shows all dates before and including the listed date.
Boolean Queries
Logical statements analyze two or more queries for truth value. The logical operators are in capital letters for visual reasons and work equally well in lowercase. Boolean queries run for both text queries or when searching through fields.
There are three logical operators in KQL:
1. The AND operator requires both terms to appear in a search result. Use AND to locate all instances where two terms appear:
<query> AND <query>For example:
elasticsearch AND get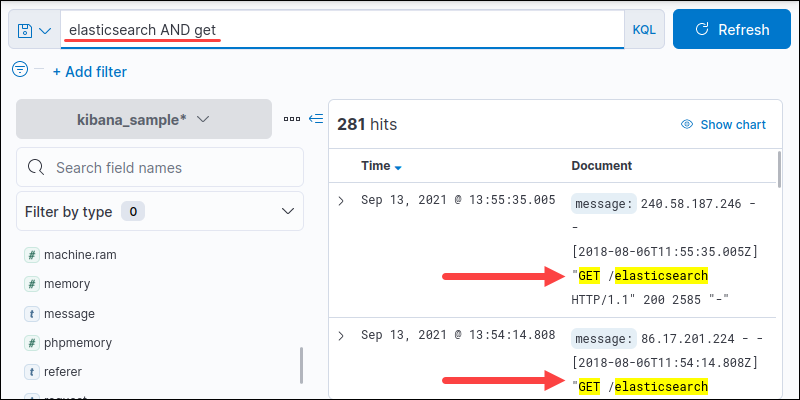
Combine the AND operator with field queries to locate all instances where both query terms appear in specific fields:
<field name> : <query> AND <field name> : <query>For example, search for all instances where Windows XP had a 400 response:
machine.os.keyword : "win xp" AND response.keyword : "404"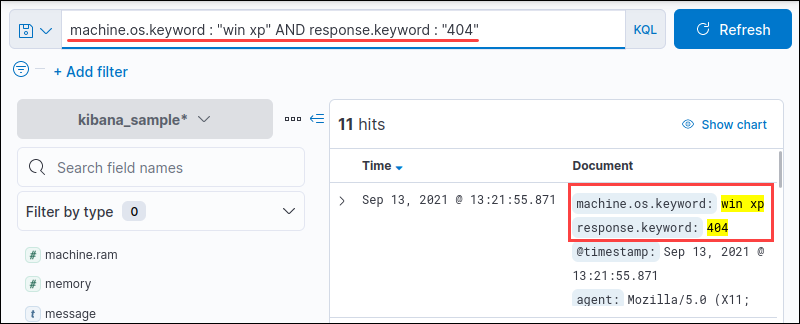
The output shows all results where both win xp and 404 appear together.
2. The OR operator requires at least one argument to be true. The syntax is:
<query> OR <query>For example:
elasticsearch OR get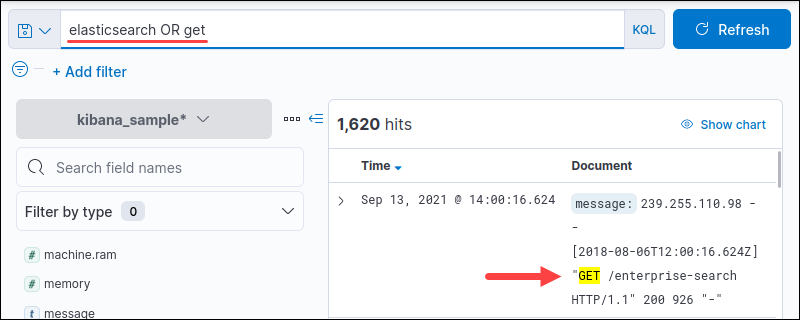
Merge the OR operator and field queries to locate all instances where either query terms appear in specific fields:
<field name> : <query> OR <field name> : <query>For example, search for all results where the OS is Windows XP, or the response was 400:
machine.os.keyword : "win xp" OR response.keyword : "404"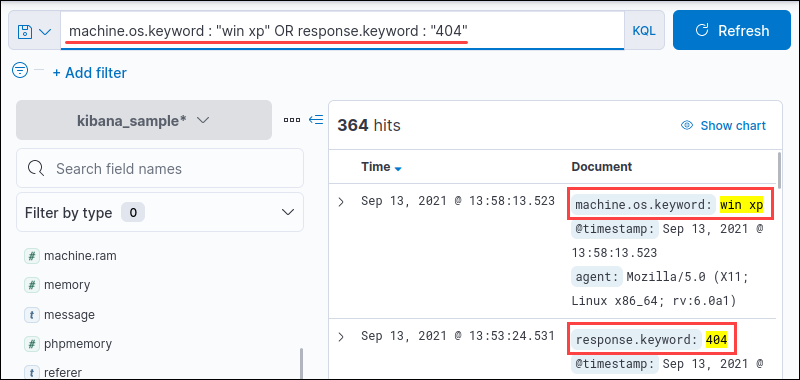
3. The NOT operator negates the search term. For example, search for any response keyword except 404:
NOT response.keyword : "404"Alternatively, use - or ! before the search term to denote negation.
Kibana Filter
The Kibana filter helps exclude or include fields in the search queries.
1. Create a filter by clicking the +Add filter link.
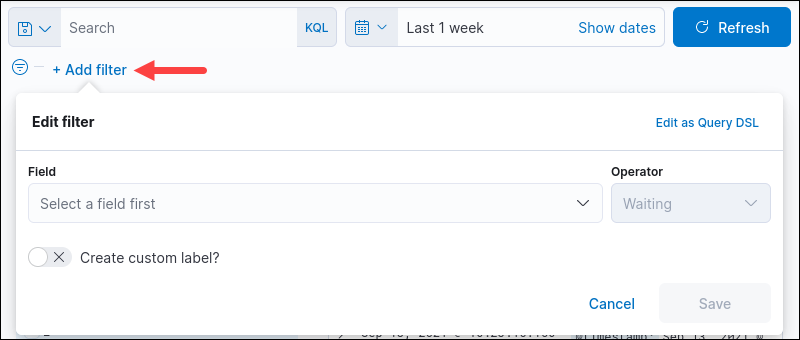
A dialog box appears to create the filter.
2. Select a Field from the dropdown menu or start searching to get autosuggestions.
3. Choose an Operator from the dropdown menu.
4. An additional Value field appears depending on the chosen operator. The exists and does not exist options do not require the Value field while all other operators do. Choose the filtering value if the operator needs it.
5. As an optional step, create a custom label for the filter. Tick the Create custom label? checkbox and provide a name. Click Save to finish.
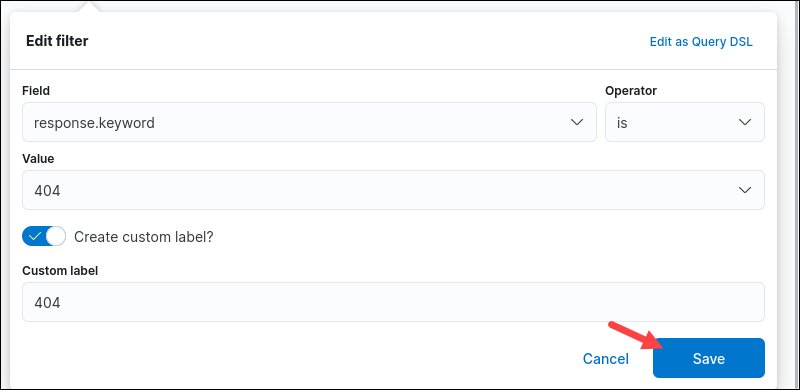
The filter appears below the search box and applies to current data and all further searches automatically.

Add multiple filters to narrow the dataset search further.
Kibana Visualization
Visualization in Kibana is the crucial feature with many options for visualizing and presenting data.
Kibana Visualization Types
When creating a visualization, there are five editors to select from:
1. Lens creates visuals in a drag-and-drop interface and allows switching between visualization types quickly. The interface is recommended for most use cases.
2. Maps is an editor used for geographic data and layers information on a map.
3. TSVB is an interface for advanced time series analysis.
4. Custom visualizations uses the Vega syntax to create custom graphs.
5. Aggregation-based visualizations use the standard library to create charts.
Kibana additionally provides two extra tools to enhance presentations:
1. Text and image tool.
2. Controls tool for adding sliders and dropdown menus.
All the tools work together to create dashboards for presenting data.
Kibana Aggregations
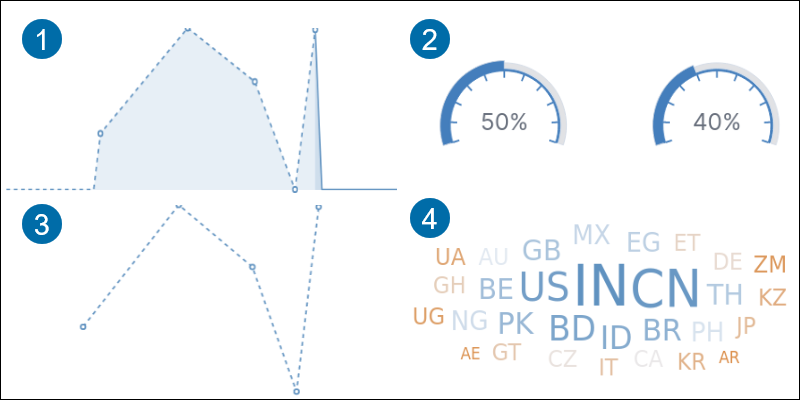
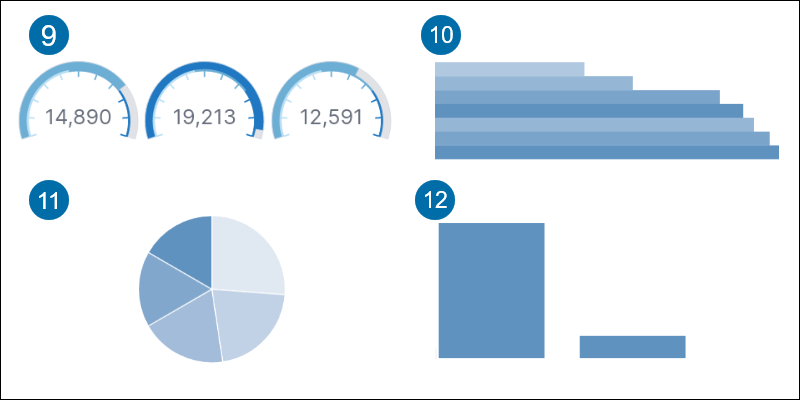
The Kibana aggregation tool provides various visualizations:
1. Area highlights data between an axis and a line.
2. Goal tracks the metric progress to a specified goal.
3. Line displays data as a series of points.
4. Tag cloud shows word frequency.
5. Data table shows data in rows and columns.
6. Heat map displays data in a cell-matrix with shaded regions.
7. Metric shows a calculation result as a single number.
8. Timelion graphs time series data.
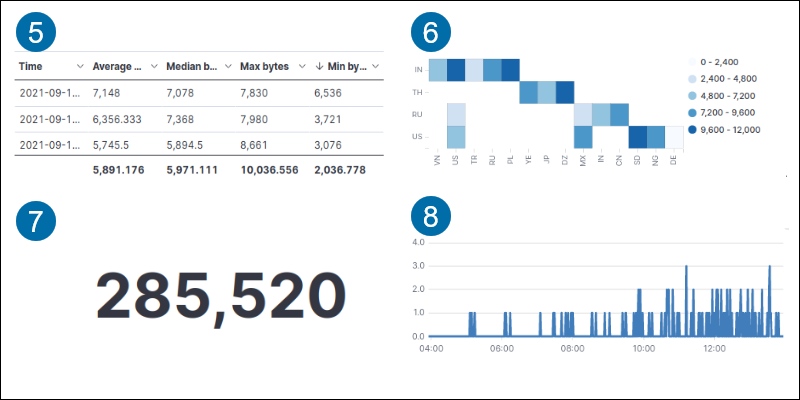
9. Gauge shows a metric status.
10. Horizontal bar displays data in horizontal bars on an axis.
11. Pie compares data in portions compared to a whole.
12. Vertical bar shows data in a vertical bar on an axis.
Create a Visualization in Kibana
To create a visualization in Kibana:
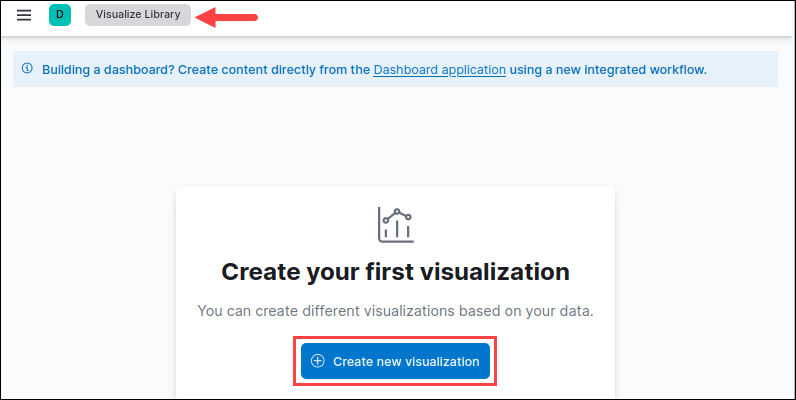
1. Search for Visualize Library in the top search bar (shortcut CTRL+/) and press Enter.
2. Click the Create new visualization button.
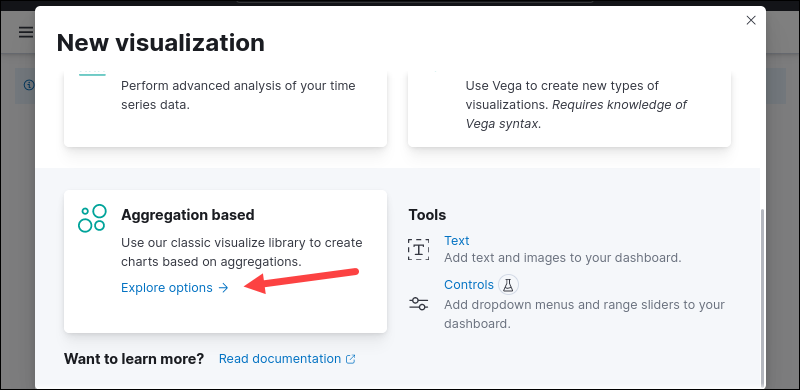
3. Select a visualization type from the list. For example, scroll down and choose Aggregation based.
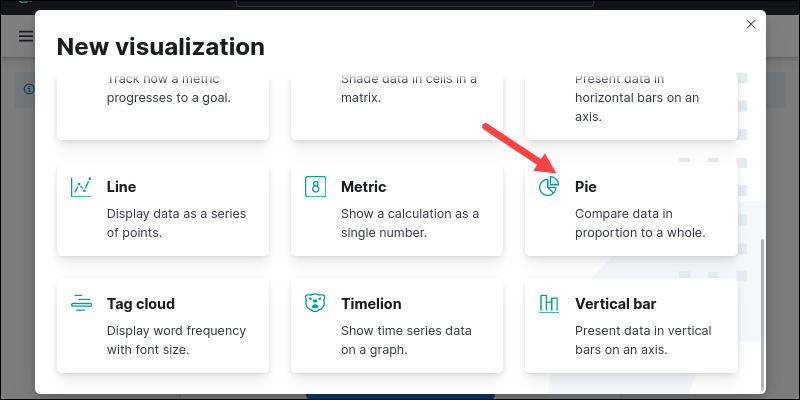
4. From the options list, locate and select Pie to create a pie chart.
5. Search for the index pattern by name and select it to continue. A creation dashboard appears.
6. Select Metrics for the data. The count metric is selected by default.
7. Add a Bucket parameter and select Split Slices.
8. Choose options for the required fields. For example, set the Aggregation to Terms and the Field to machine.os.keyword.

9. Press the Update button (shortcut CTRL+Enter) to view the pie chart.
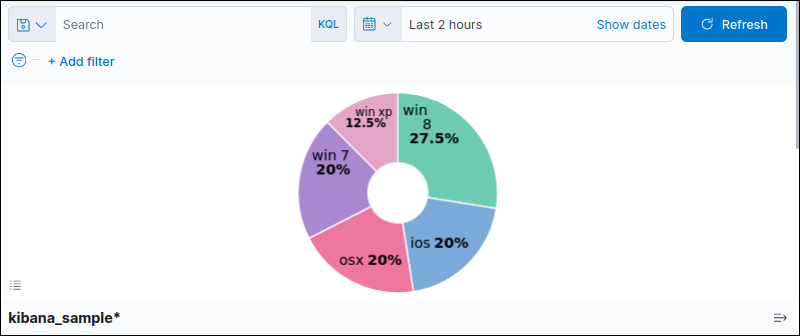
Play with the options, filtering, and timeline to adjust the visualization.
10. When finished, click the Save button in the top right corner. Name the chart and select New to make a new dashboard.
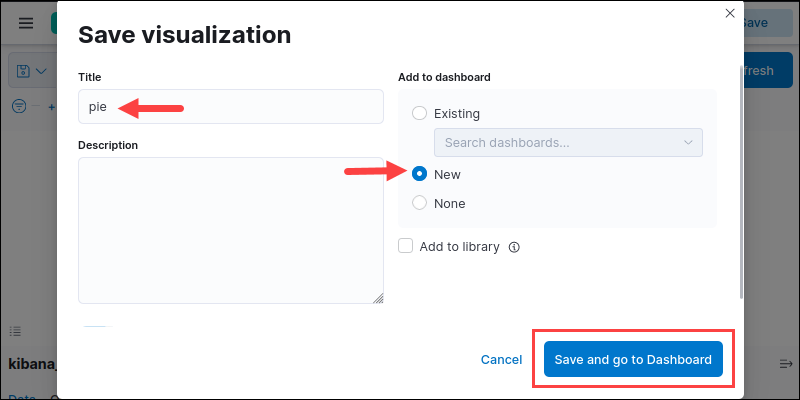
Click Save and go to Dashboard to see the visualization in the dashboard. Save the dashboard and type in a name for it.
Share Kibana Visualizations
Share the dashboard in real-time or a snapshot of the current results. To share a Kibana dashboard:
1. Open the dashboard you'd like to share.
2. Click Share in the menu bar.

3. Choose the Embed Code option to generate an iFrame object. Alternatively, select the Permalink option to share via link.
Conclusion
At the end of this guide, you should know how to add an index pattern, query data, and create visualizations on a Kibana dashboard. Next, secure the data and dashboard by following our tutorial: How to Configure Nginx Reverse Proxy for Kibana.
