The simplest way to secure a Kibana dashboard from unauthorized access is to set up an Nginx reverse proxy. The reverse proxy ensures that only users with proper credentials can access Kibana (and the data in Elasticsearch).
This guide shows how to configure Nginx as a reverse proxy for Kibana.

Prerequisites
- Elasticsearch and Kibana installed.
- Access to a terminal window/command line.
- A user account with sudo privileges.
Note: To set up the Elastic stack, refer to our guide: Install ELK Stack on Ubuntu.
Configure Nginx Reverse Proxy for Kibana
To configure a reverse proxy for Kibana, adjust the settings for Kibana, Elasticsearch, and Nginx. In this setup, the Nginx web server acts as a reverse proxy and secures Kibana and Elasticsearch data by enforcing authentication.
Note: Create a strong password if working with actual data. Use our free password generator or refer to our guide on strong password ideas. Change the password often and use a password manager to store the credentials.
The steps below show how to set up authentication for local access to Kibana.
Step 1: Configure Kibana
Edit Kibana's configuration file to specify the port and host address:
1. Open the file using a text editor. If using nano, run:
sudo nano /etc/kibana/kibana.ymlThe file contains various settings for running Kibana.
2. Change the server.host and the server.port address to the following values:
server.host: "localhost"server.port: 5601
These are the Kibana default values, which are commented out on a fresh installation. Remove the comment or adjust the values to a different server and port.
3. Save the file and exit nano.
4. Reload the source configuration:
sudo systemctl daemon-reloadThe command produces no output.
5. Lastly, restart the Kibana service with the command:
sudo service kibana restartRestarting applies the new settings. If the restart is successful, the command produces no output.
Step 2: Configure Elasticsearch
Edit the Elasticsearch configuration file and adjust the host and port:
1. Open the configuration file:
sudo nano /etc/elasticsearch/elasticsearch.ymlThe YAML file contains various Elasticsearch configurations.
2. Find the following lines and change the default http.port and network.host values:
http.port: 9200network.host: localhost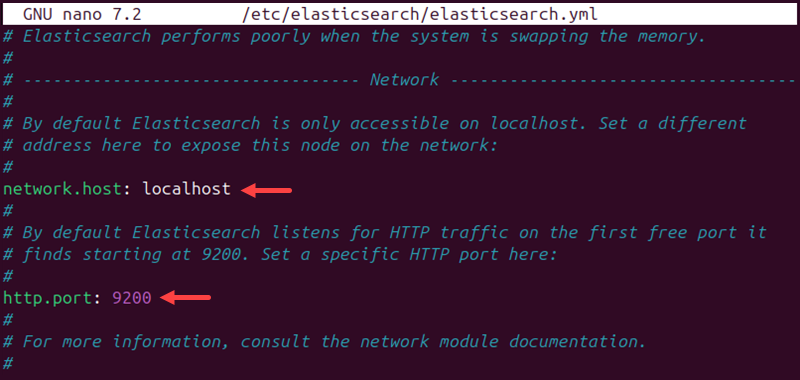
These are the default Elasticsearch values. Adjust to a different port and host if using different settings.
3. Save the file and close nano.
4. Restart the Elasticsearch service:
sudo service elasticsearch restartThe service takes some time to restart. If there are no errors, the service restarts successfully and applies the new settings.
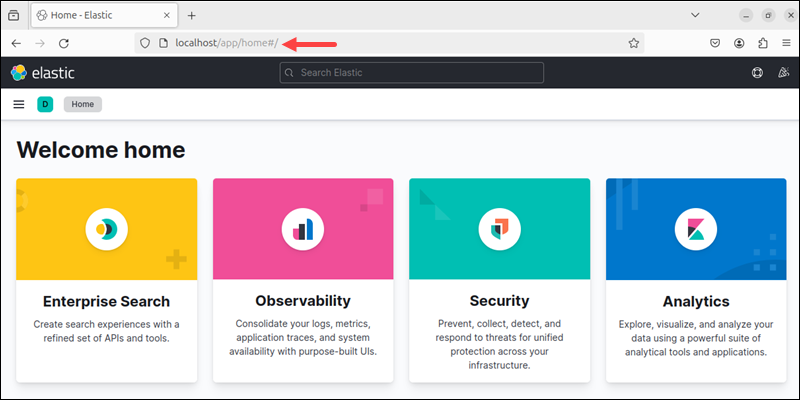
5. Verify that Kibana works. Open a web browser and navigate to the following URL:
http://localhost:5601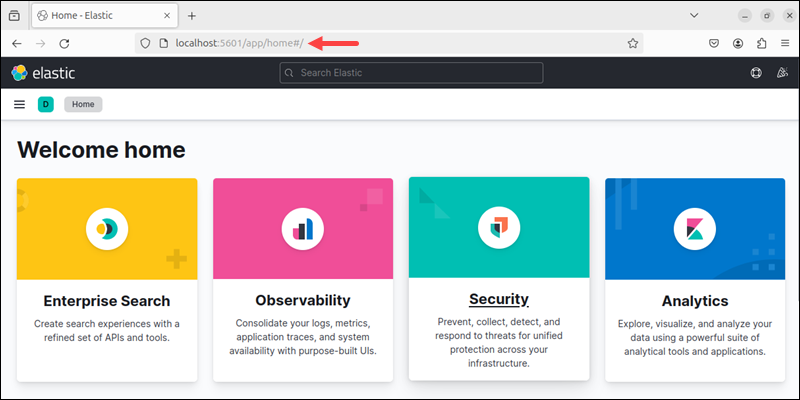
The page redirects to the Elastic home page. If using a different port and address, adjust the URL.
Step 3: Install and Configure Nginx
The next step is to install and set up Nginx:
1. Install Nginx using the following apt command:
sudo apt install nginxNote: For more detailed instructions, refer to our guide: How to Install Nginx on Ubuntu 22.04.
2. Install apache2-utils, a utility:
sudo apt install apache2-utilsThe utility helps create password-protected accounts.
3. Create a user account for Kibana access.
sudo htpasswd -c /etc/nginx/htpasswd.users [username]
Replace [username] with the actual username. Provide a password when prompted, and retype a password to confirm the creation.
5. Create a configuration file for Nginx for the Kibana site:
sudo nano /etc/nginx/sites-available/kibanaThe command creates a new config file.
6. Add the following content:
server {
    listen 80;
    server_name localhost;
    location / {
        auth_basic "Restricted Access";
        auth_basic_user_file /etc/nginx/htpasswd.users;
        proxy_pass http://localhost:5601;
        proxy_set_header Host $host;
        proxy_set_header X-Real-IP $remote_addr;
        proxy_set_header X-Forwarded-For $proxy_add_x_forwarded_for;
        proxy_set_header X-Forwarded-Proto $scheme;
    }
}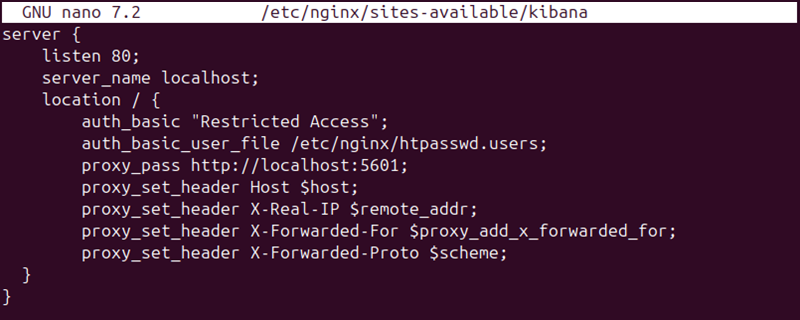
The file listens on the HTTP port and resolves localhost to the Kibana dashboard. The configuration restricts access and establishes authentication based on the data in the /etc/nginx/htpasswd.users file.
7. Save the changes and exit the editor.
8. Create a soft symbolic link to the file in the /etc/nginx/sites-enabled/ directory:
sudo ln -s /etc/nginx/sites-available/kibana /etc/nginx/sites-enabled/The command tells Nginx to activate the configuration file and serve the Kibana web page.
9. Test the file's syntax with:
sudo nginx -t
The command tests the file's syntax and checks the configuration. The page will not work if there are any errors in this check.
10. Restart Nginx and Kibana services by running:
sudo service nginx restartsudo service kibana restartIf the restarts do not work, check the system logs using journalctl and address all configuration errors.
Step 4: Test Authentication
Lastly, test Kibana access and the authentication:
1. Open a web browser and go to the IP address assigned to Kibana. If using the default values, the address is https://localhost.
2. Before loading the page, an authentication window appears.
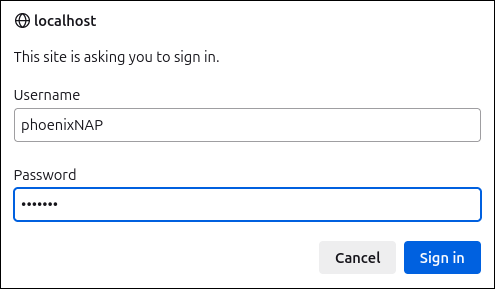
Enter the credentials configured during Nginx setup, then select Sign In.
3. If the credentials match, the browser opens the Elastic welcome page on localhost.
If the credentials are incorrect, Nginx shows a 401 error page instead.
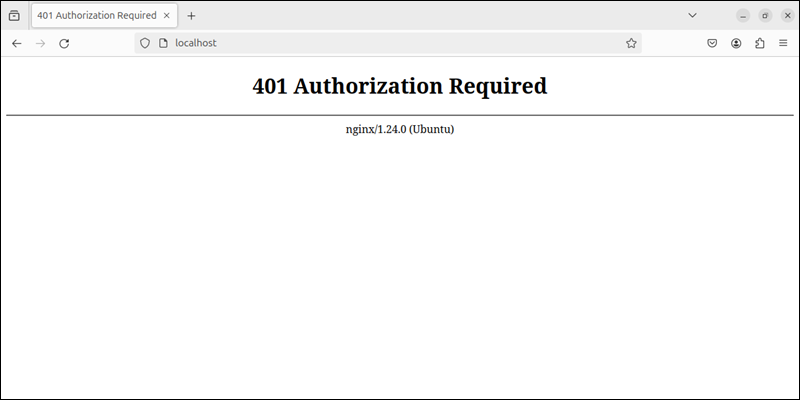
Successful access to the page indicates the proxy and credentials work as expected.
Conclusion
This guide showed how to configure Nginx reverse proxy for Kibana. The reverse proxy is an additional security layer that protects the Elasticsearch data managed through Kibana.
Next, see the Kibana visualization features in our Kibana tutorial.


