Among the many network security tools on the market, Wireshark stands out for its ability to capture and display packets in real time, which is especially useful for network troubleshooting and analysis.
Wireshark is easy to use and a great option for beginners, but it is also powerful enough for professionals who need detailed insights into network traffic.
This guide explains how to install Wireshark and how to use it to identify connectivity issues, detect suspicious activity, and analyze your network's performance.

What Is Wireshark?
Wireshark is a free and open-source network protocol analyzer. It captures and displays the full content of packets, including all protocol layers (e.g., Ethernet, HTTP, TCP).
Wireshark can analyze network traffic in real time or inspect previously captured packet data. This makes it a valuable tool for reviewing network behavior, troubleshooting, and identifying potential security threats.
Wireshark is compatible with most major operating systems, including Windows, Linux, and macOS.
Check out our guide on how to install Wireshark on Ubuntu.
Why Use Wireshark?
If you are new to Wireshark, the first thing you'll notice is its user-friendly graphical interface (GUI), which displays captured packets with detailed protocol-level information. This data provides direct visibility into what is really happening across the network.
Use Wireshark because it is:
- Free of charge, with no hidden subscriptions or licensing fees.
- Open-source and actively maintained and supported by a strong, vibrant community.
- Capable of recognizing and decoding hundreds of protocols, including TCP, UDP, HTTP, TLS, DNS, and many more.
- Compatible with Windows, Linux, and MacOS.
- Able to capture live traffic as it flows through the network interface, including source and destination IP addresses, protocol types, and payload information.
- Useful for offline analysis, allowing you to inspect previously saved packet captures.
- Equipped with powerful display and capture filters to narrow down relevant traffic quickly.
Wireshark Benefits
Wireshark has many features that enable you to monitor everyday network traffic as well as deep-dive into packet analysis. The advantages of using Wireshark include:
- All-in-one network analysis tool. Use Wireshark for diagnostics, improving network performance, incident response, and digital forensics.
- Powerful visualizations. Includes a color-coded packet viewer, interactive graphs, protocol hierarchy trees, and stream reconstruction tools.
- Deep inspection capabilities. Users can investigate every layer of the captured traffic. Captured data packets reveal protocol behaviors, ports, flags, headers, and metadata for full context in each transaction.
- Support for both wired and wireless networks. Analyzes traffic from Ethernet, Wi-Fi, loopback, and other interface types.
- Traffic decryption. Supports decrypting SSL/TLS, WPA/WPA2, and other encryption protocols with the necessary keys.
- Custom coloring rules. Highlight specific traffic patterns to quickly identify protocols, errors, or anomalies.
- Real-time packet capture and post-capture analysis. Easily switch between live monitoring and offline reviews of captured payloads.
- Plugin and scripting support. Supports custom protocol dissectors and automating workloads via Lua scripts.
How to Install Wireshark
The following sections explain the fastest way to install the Wireshark GUI version on Linux, Windows, and macOS.
Note: Wireshark is a GUI-based application. Linux distributions that do not include a graphical environment by default, like Alpine or Arch Linux, must have a desktop environment installed before running Wireshark. However, given the minimalist nature and intended use of these systems, the tshark command-line version of Wireshark is often a better fit for capturing and analyzing traffic.
Install Wireshark on Linux
Complete the steps below to install Wireshark on Linux:
1. Install Wireshark
Access the command line and enter the installation command for your Linux distribution:
| Distribution | Command to Install Wireshark |
|---|---|
| Ubuntu/Debian | sudo apt install wireshark -y |
| Fedora/Rocky Linux/RHEL | sudo dnf install wireshark -y |
| openSUSE | sudo zypper install wireshark -y |
Note: Kali Linux is commonly used for network analysis and penetration testing. It includes Wireshark by default, and no additional installation is required.
2. Allow Non-Root Packet Capture (Debian-Based Distributions Only)
During the installation on Debian-based distributions, such as Ubuntu, you will encounter the following prompt:
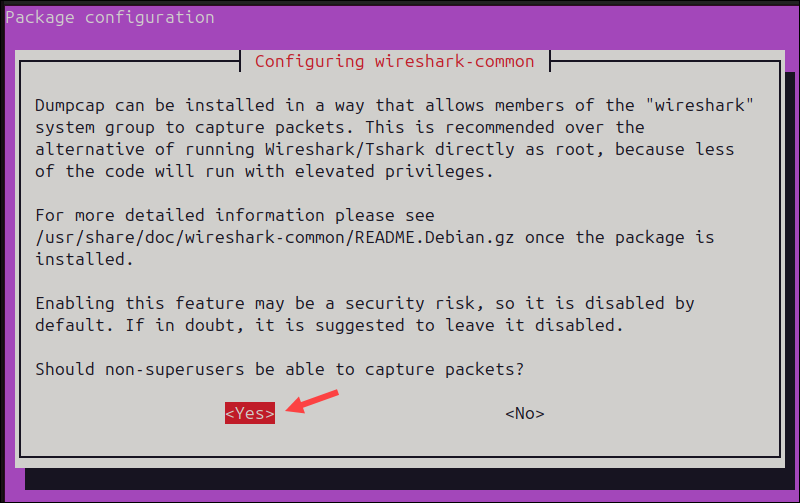
When prompted, select Yes and press Enter to enable non-root users to capture network packets. This means you no longer need to run the entire application with sudo privileges. Wireshark is now easier and safer to use.
3. Add User to Wireshark Group
To add the current user to the wireshark system group, enter:
sudo usermod -aG wireshark $USEROnly users from the wireshark group are now able to capture packets without root privileges.
4. Set Permissions for dumpcap (Fedora, Rocky, and RHEL Only)
Wireshark uses the helper binary dumpcap to capture packets. On Fedora, Rocky Linux, and RHEL, you must manually grant dumpcap the necessary capabilities to allow packet capture without root privileges:
sudo setcap cap_net_raw,cap_net_admin=eip $(which dumpcap)The dumpcap binary can now capture traffic without full root access.
Note: This step is not necessary on Debian-based systems if you selected Yes when prompted during installation.
5. Log Out and Log Back In
Log out or restart your system for the group membership to take effect.
Install Wireshark on Windows
To install Wireshark on Windows, follow the steps in the sections below.
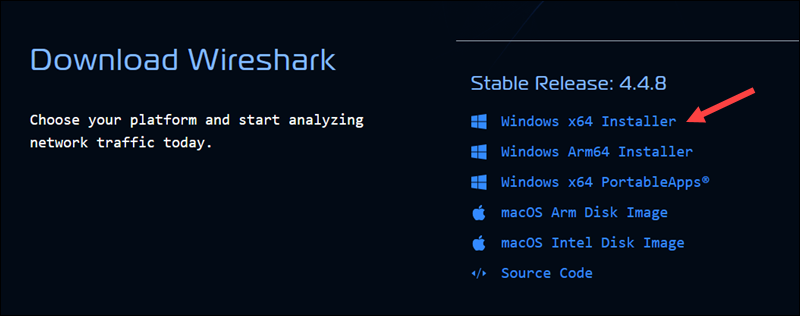
1. Download the Installer
Visit the official Wireshark download page and click Windows x64 Installer to download the latest stable release.
2. Install Wireshark
Double-click the downloaded .exe file to launch the Wireshark installation wizard and follow the on-screen instructions.
3. Select Components
When prompted, choose which Wireshark components to install. If you are unsure, leave the default selection and click Next.
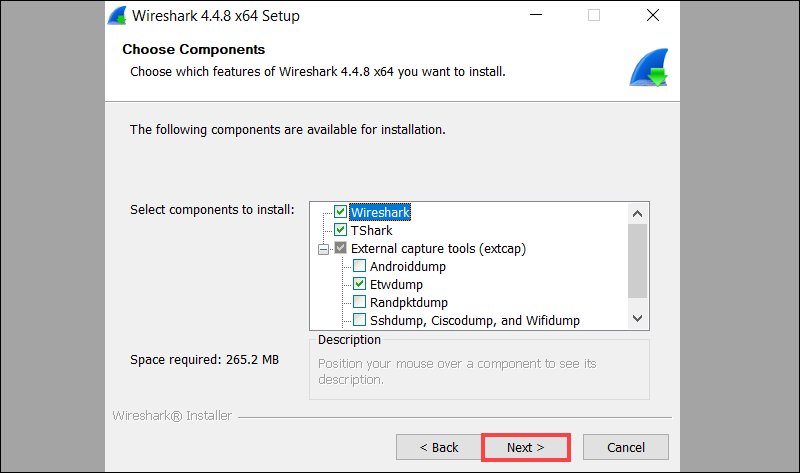
Additional tools can be added or removed later.
4. Install Npcap (Required)
Npcap is a packet capture driver that allows Wireshark to capture live network traffic. The option is usually preselected.
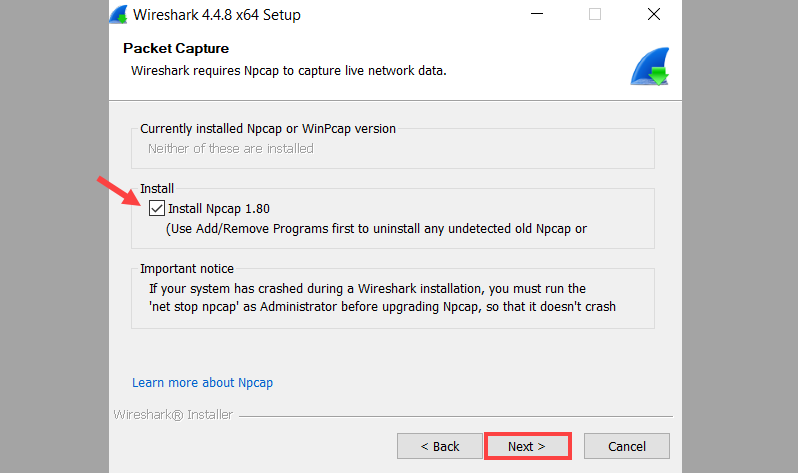
Leave it enabled and click Next.
5. Install USBPcap (Optional)
USBPcap enables Wireshark to capture USB traffic. Leave this optional component unchecked unless you specifically need USB packet capture.
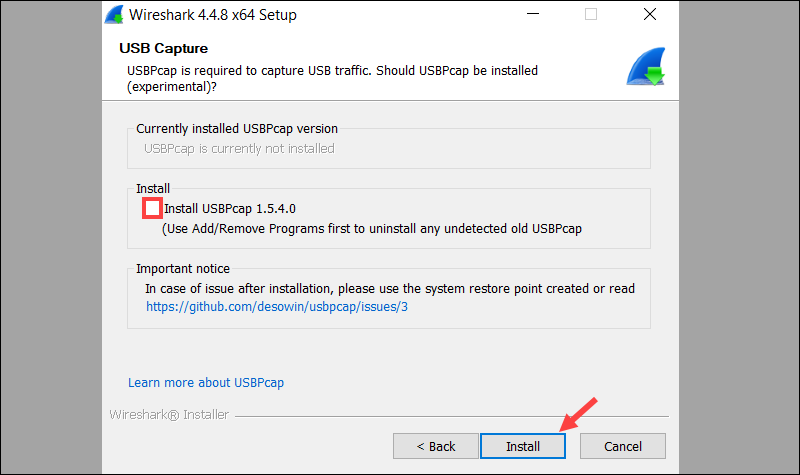
Click Install to begin the installation process.
6. Launch Wireshark
After the installation is completed, launch the Wireshark application from the Start menu or desktop shortcut.
Install Wireshark on macOS
To install Wireshark on macOS, follow the steps in the sections below.
1. Download Wireshark Installer
Navigate to the official Wireshark Download page and download the macOS Arm Disk Image or macOS Intel Disk Image, depending on your Mac architecture.
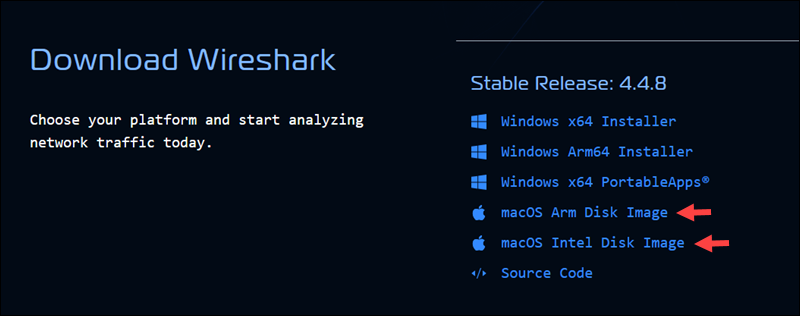
Note: To check your Mac architecture, go to the Apple menu >> About this Mac section. If it says Intel, download the Intel version, and if it says Apple M1/M2/M3, download the Arm version.
2. Open the Disk Image
Double-click the downloaded .dmg file to open the installation disk image.
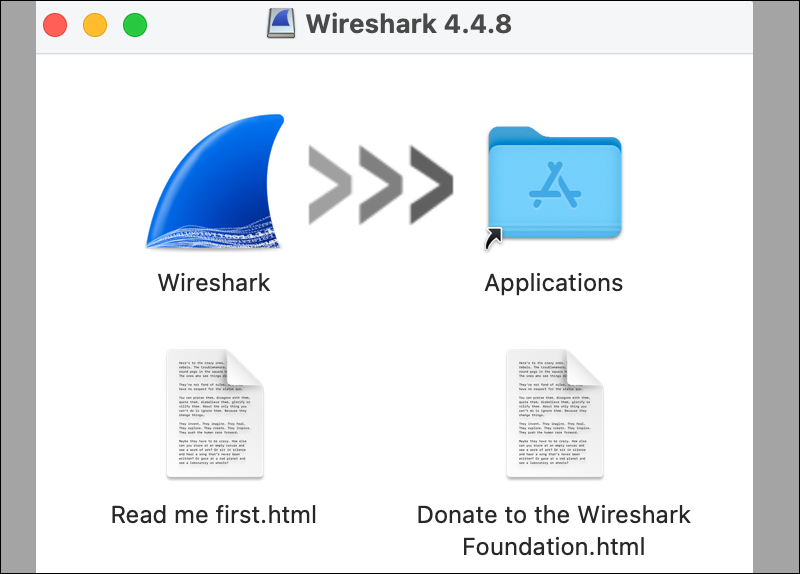
3. Copy Wireshark to Applications
Drag the Wireshark icon into the Applications folder.
4. Open Wireshark
After the Wireshark app bundle is copied, launch Wireshark from the Applications folder.
How to Use Wireshark?
The graphical interface is the primary method for capturing and analyzing network traffic in Wireshark. Users can interact with toolbars, menus, and visual displays to interpret network data in real time. Captured data can also be exported and saved for later analysis.
Alternatively, users can issue commands through tshark, the Wireshark command-line tool. While it lacks a graphical interface, it offers similar functionality and is well-suited for headless servers or systems without a GUI.
Wireshark Packet Sniffer Explained
Packet capture is also known as sniffing. The term sniffing refers to passive traffic observation, where the tool intercepts and logs packets that travel across a network without modifying them. Wireshark places the selected network interface into Promiscuous mode, allowing it to capture every packet it sees.
It breaks each captured packet into protocol layers, like Ethernet, IP, and TCP, and displays both the raw byte stream and a decoded readable version.
Start a Packet Capture
To capture and analyze packets in Wireshark:
1. Launch Wireshark.
2. Select a network interface from the list. Ideally, one that shows active traffic.
3. Click the blue shark fin button to begin capturing packets.
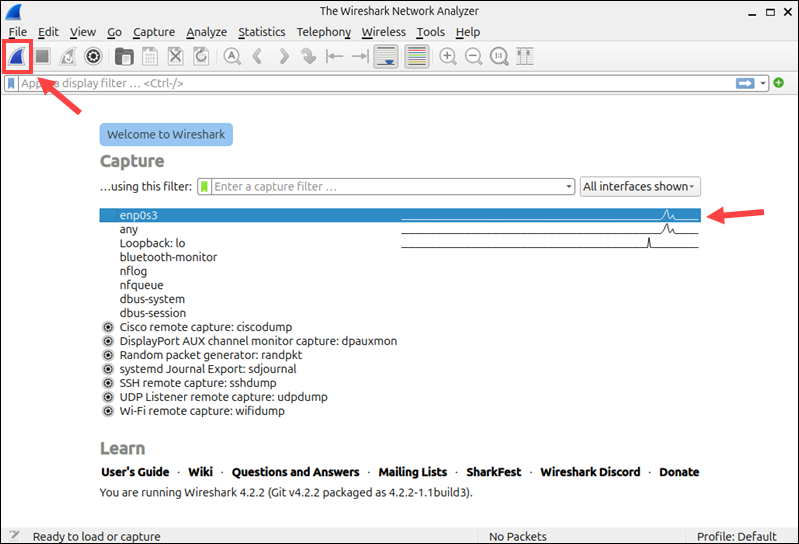
Wireshark immediately starts capturing traffic and displays it in real time.
Review Packet List
Each row in the top pane represents one packet.
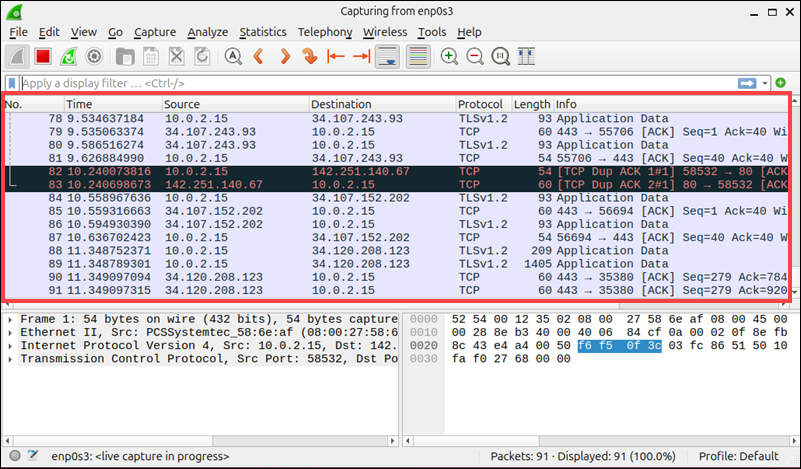
The columns contain the following information for each network packet:
| Column | Description |
|---|---|
| No. | The packet number in the capture sequence. |
| Time | The time elapsed since the start of the capture. |
| Source | The IP or MAC address from which the packet originated. |
| Destination | The IP or MAC address to which the packet is being sent. |
| Protocol | The protocol type, for example, TLS v1.2, TCP, ICMP, etc. |
| Length | The size of the packet in bytes. |
| Info | A summary of the packet's function or contents. |
Inspect Packet Details
By selecting a packet in the list, you can populate two additional panes. The lower left pane organizes the packet structure by protocol layer. Users can expand the layers to review individual packet headers and their payloads.
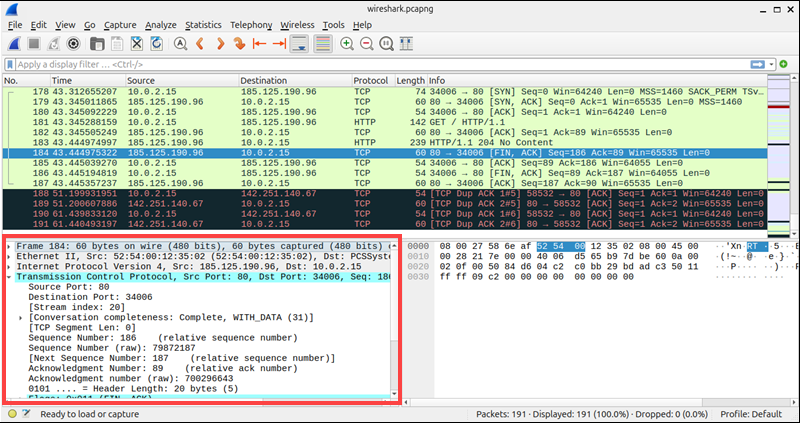
View Raw Bytes
The bottom right pane shows the packet's raw byte stream in both hexadecimal and ASCII format.
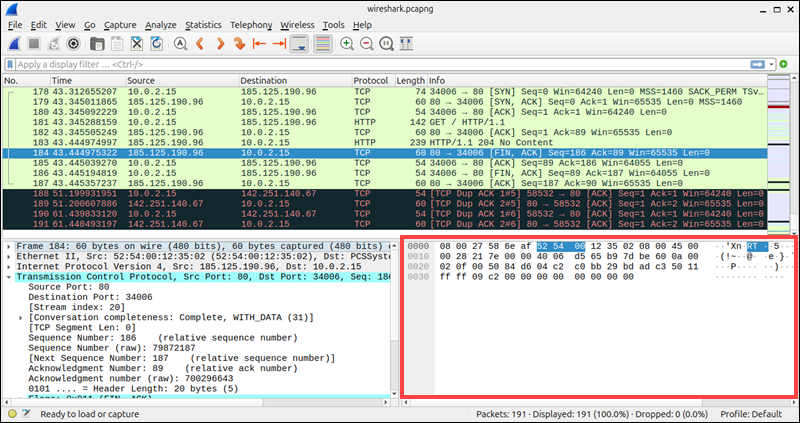
This information is helpful for identifying protocol anomalies, inspecting application-layer payloads, or debugging binary protocols.
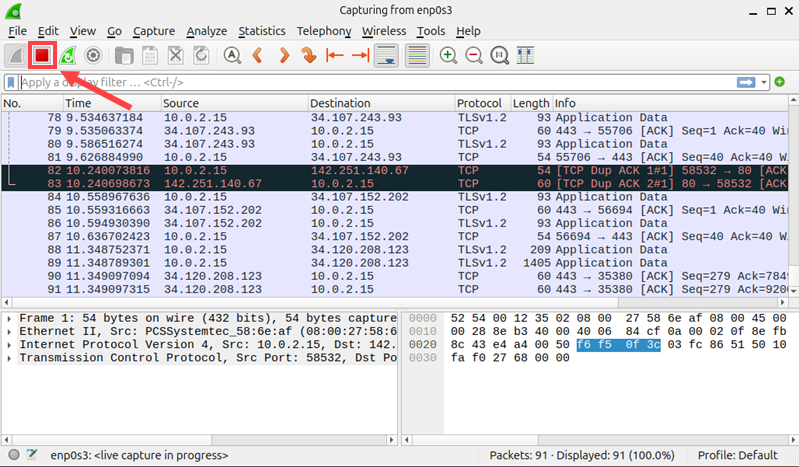
Stop Capture and Save Data
When you are ready to stop capturing packets, click the red Stop button in the toolbar.
To save the captured data, go to File and click Save As to store the session as a .pcapng file.
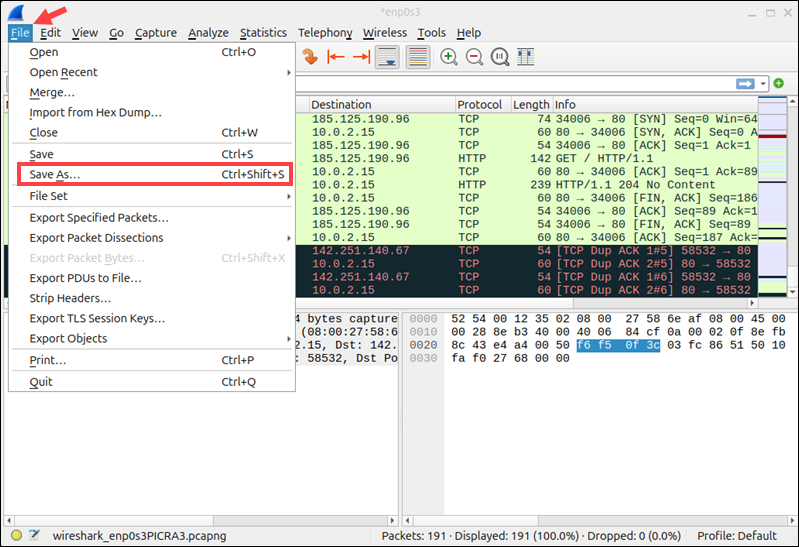
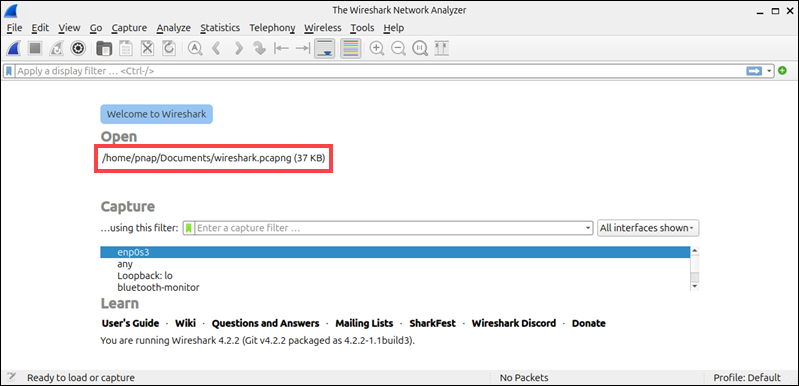
You can reopen saved captures from the main screen's recent files list.
The .pcapng format allows you to share files with others to collaborate on troubleshooting and resolving network issues.
Wireshark Filters Explained
Wireshark captures vast amounts of data. It can be challenging to identify the specific packets you need to analyze. Filters allow you to narrow down the vast amount of data to a manageable amount.
There are two types of filters in Wireshark, capture filters and display filters.
Wireshark Capture Filters
Capture filters are applied before capturing packets. They limit what Wireshark records and cannot be changed once the capture starts.
To set up capture filters in Wireshark:
1. Click Capture in the toolbar and select the Capture Filters option.
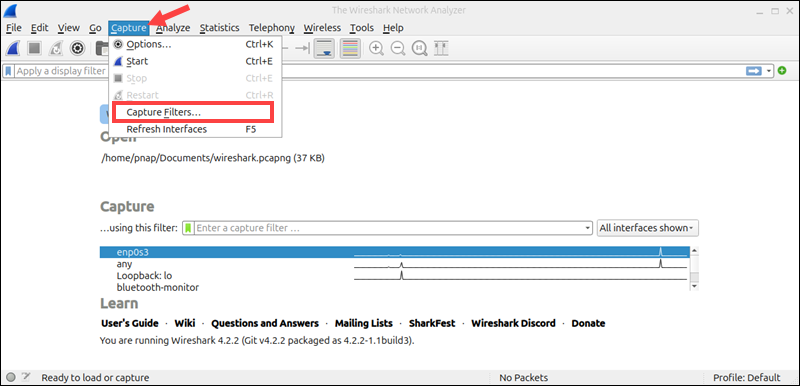
2. Click the + sign to add a new filter.
3. Enter the filter name and corresponding expression. For example:
| Capture Filter | Description |
|---|---|
tcp | Only capture TCP traffic. |
port 80 | Only capture traffic on port 80. |
host 192.168.1.1 | Only capture traffic to and from the specified IP. |
4. Select OK to save the filter.
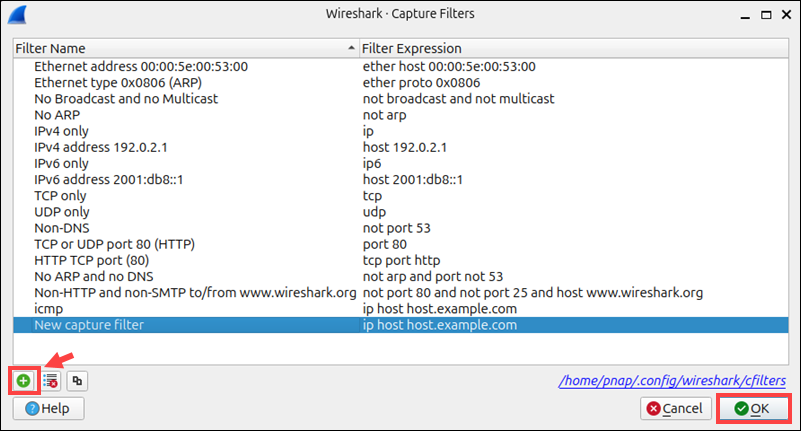
Once you start the capture process, the new filter will be applied.
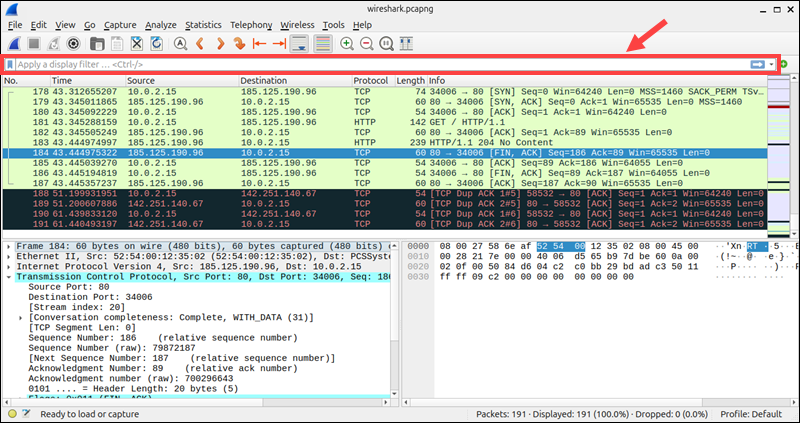
Wireshark Display Filters
Display filters are applied after capture and define what Wireshark displays in the packet list. Use the filter bar above the package list to apply display filters.
For example, you can apply the following filters:
| Display Filter | Description |
|---|---|
http | Only show HTTP traffic. |
ip.addr == 192.168.1.1 | Only show traffic to and from a specific IP. |
tcp.flags.syn == 1 | Show TCP SYN packets (connection attempts). |
dns.qry.name contains "example.com" | Show DNS queries for "example.com". |
Display filters are non-destructive and can be changed at any time.
Wireshark and Ping Utility
Wireshark can capture and analyze ICMP Echo request and reply packets, generated by the ping command.
To monitor ping activity in Wireshark:
1. Start capturing packets in Wireshark.
2. Open a terminal and enter the following command:
ping 8.8.8.83. Apply a display filter by typing the following into the filter field and pressing Enter:
icmp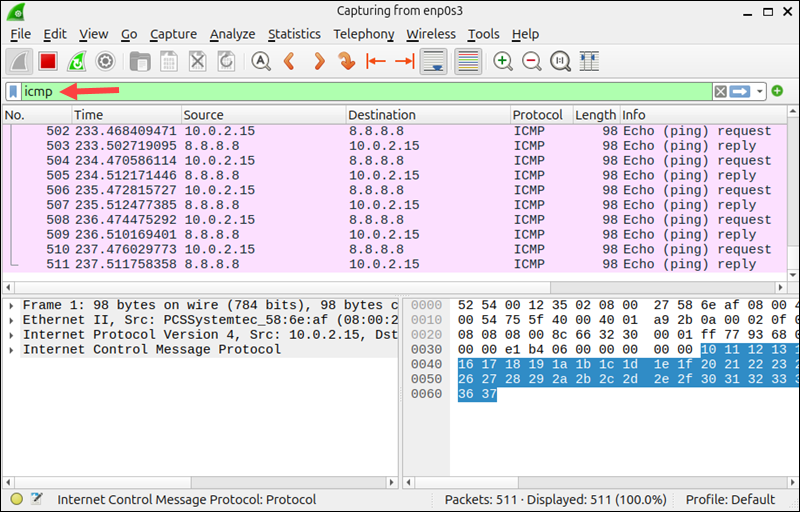
Wireshark displays Echo request and reply packets as well as round-trip time (RTT) and Time To Live (TTL) values.
This data is useful for diagnosing network latency, packet loss, and general connectivity issues.
Wireshark Colorization Options
Wireshark applies default color rules to highlight different packet types and conditions in the packet list. These visual cues help users quickly spot patterns, distinguish between protocols, and detect anomalies.
To review or customize color rules in Wireshark
1. Open the View menu and select Coloring Rules.
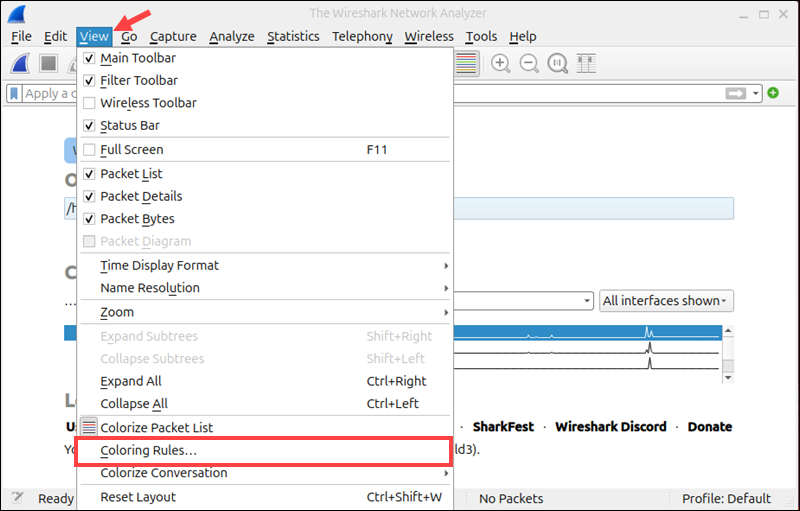
2. This opens a window listing current rules, their filter expressions, and assigned colors. The default colors include:
| Color | Meaning |
|---|---|
| Light Blue | TCP traffic |
| Light Green | HTTP traffic |
| Black | Malformed or error packets |
| Dark Blue | DNS traffic |
| Red | TCP retransmission or issues |
3. To add a custom rule, click the + button.
4. Enter a name for the rule, for example, Blocklisted IP.
5. In the Filter field, enter a valid display filter expression, such as:
ip.addr == 192.0.2.1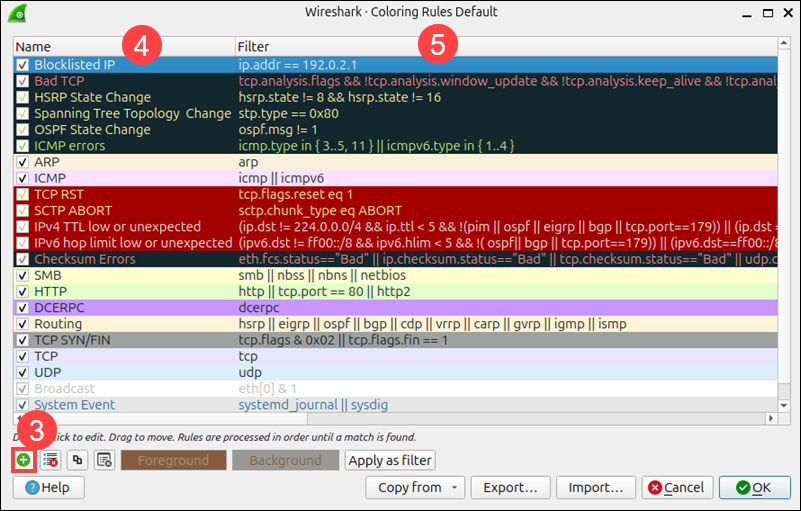
6. Use the Foreground and Background tabs to choose custom colors.
7. Click OK to apply the changes.
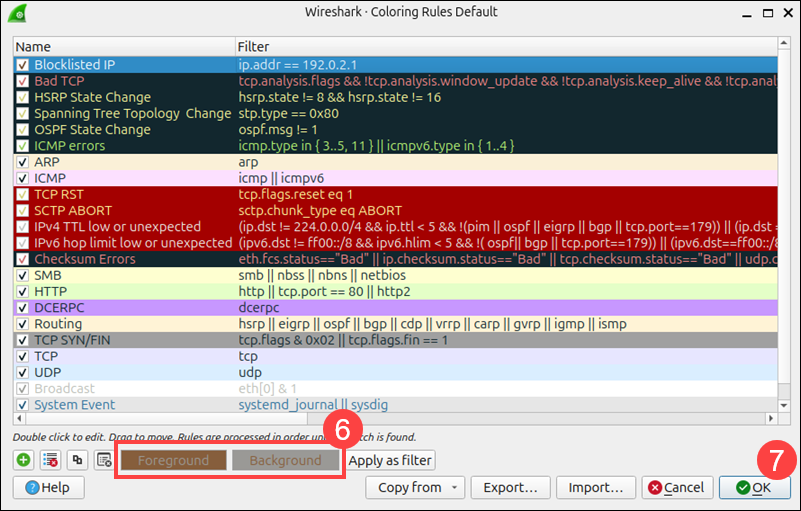
Now the blocklisted IPs will appear in the packet list in the color you selected.
Note: To remove all coloring from the packet list and display packets in plain text, click the Colorize Packet List option in the View menu.
Wireshark Promiscuous Mode
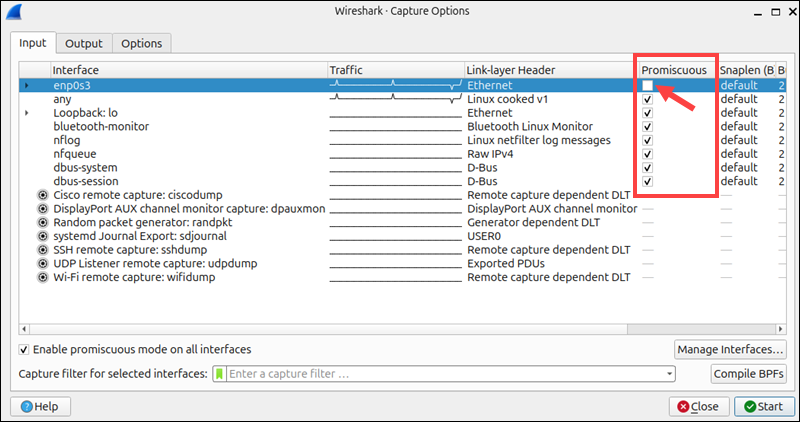
Promiscuous mode allows Wireshark to capture all packets that are visible to a network interface. This mode is enabled by default on all interfaces.
While Promiscuous mode is useful for general network analysis, in some environments it may violate privacy policies or regulations, especially if the packets are not intended for your device.
To disable Promiscuous mode, press Ctrl+K and uncheck the Promiscuous box for the individual interfaces you want to modify.
The same method can be used to turn Promiscuous mode back on. When it is turned off, Wireshark will only display packets to or from your machine on the affected interface.
Wireshark Command Line
When you install Wireshark on Windows and macOS, the package also includes tshark, its command-line equivalent. tshark provides similar packet capture functionality, minus the graphical interface. Instead of providing visual displays, tshark allows users to:
- Capture packets from interfaces.
- Apply capture and display filters.
- Display live packet information directly in the terminal.
- Save output in .pcapng files.
tshark is the preferred solution for users looking to automate tasks and embed Wireshark functionality in scripts. It is the only option when working in environments that do not have a graphical environment, such as headless servers.
Some Linux distributions, like Kali Linux, include tshark by default or bundle it with the main Wireshark package (openSUSE). However, most distributions require a separate tshark installation.
The following table lists the commands for installing tshark on Linux:
| Distribution | Command to Install tshark |
|---|---|
| Debian/Ubuntu | sudo apt install tshark -y |
| Fedora/RHEL/Rocky | sudo dnf install wireshark-cli -y |
| Arch Linux | sudo pacman -S wireshark-cli |
| Alpine | sudo apk add wireshark |
After installing tshark, access the terminal and enter the following command to list available interfaces:
tshark -D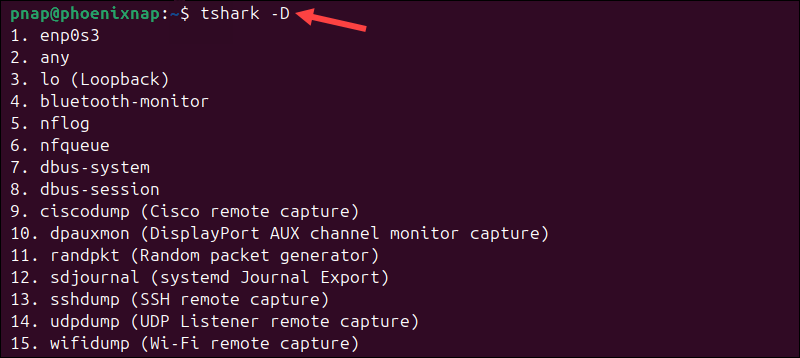
To capture traffic on interface 1 (enp0s3) and save the data to the capture.pcapng file, enter:
tshark -i 1 -w capture.pcapng
Press Ctrl+C to stop capturing packets. The capture.pcapng file now contains all the packets captured until the moment the capture was stopped.
Use the following command to write output to a file and print it to the terminal:
tshark -i enp0s3 -w capture2.pcapng -P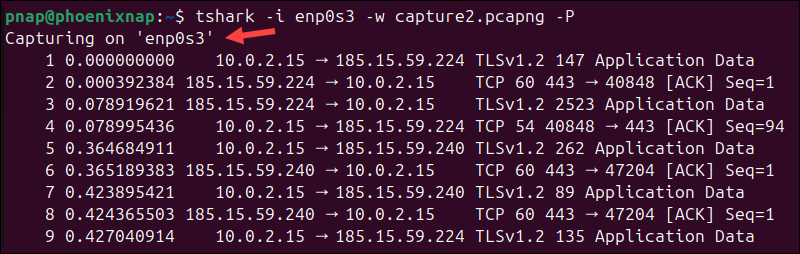
You can apply capture and display filters to identify relevant information. For example, to apply a capture filter for HTTP traffic, enter:
tshark -i enp0s3 -f "tcp port 80" -w capture2.pcapngOnce the data is saved in a file, use tshark to read and filter the file, and display the data in the terminal:
tshark -r capture2.pcapng -Y "ip.addr == 185.15.59.224"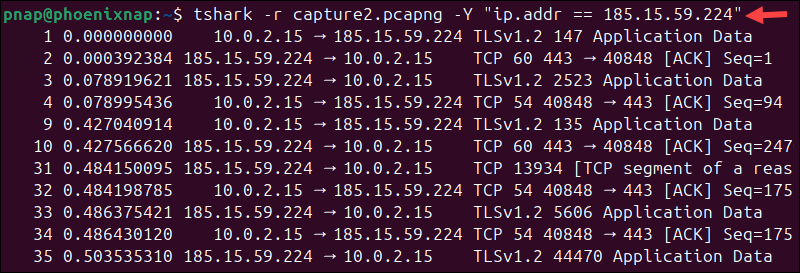
The output only displays packets from the capture2.pcapng file that are addressed to or from the specified IP address.
Wireshark Commands
The following section lists Wireshark GUI shortcuts and actions, filter operators and syntax, as well as basic and advanced tshark commands.
Wireshark GUI Shortcuts
| Shortcut | Action |
|---|---|
| Ctrl+E | Start capture. |
| Ctrl+E | Stop capture. |
| Ctrl+S or Ctrl+Shift+S | Save the current capture file. |
| Ctrl+O | Open a capture file (.pcap, .pcapng, etc.). |
| Ctrl+F | Search for a packet by string or display filter. |
| ↓ / ↑ | Move to the next or previous packet in the packet list. |
| Ctrl+↓ / Ctrl+↑ | Jump to the next or previous packet in the same conversation. |
| Enter | Expand or collapse a tree item in the details pane. |
| Backspace | Jump to the parent node in the packet details pane. |
| Tab or Shift+Tab | Navigate between UI elements (e.g., filter bar, packet list). |
Display Filter Operators
| Operator | Description | Example |
|---|---|---|
== or eq | Equal to | ip.addr == 192.168.1.1 |
!= or ne | Not equal to | ip.addr != 192.168.1.1 |
> or gt | Greater than | frame.len > 1000 |
< or lt | Less than | frame.len < 512 |
>= or ge | Greater than or equal to | frame.len >= 1500 |
<= or le | Less than or equal to | frame.len <= 64 |
and or && | Logical AND | ip && tcp |
or or || | Logical OR | ip.addr == 192.168.1.1 || ip.addr == 10.0.0.5 |
not or ! | Logical NOT | !http |
Common Display Filter Expressions
| Action | Filter Expression |
|---|---|
| Filter by IP | ip.addr == 10.10.42.1 |
| Filter by Source IP | ip.src == 10.10.42.1 |
| Filter by Destination IP | ip.dst == 10.10.42.1 |
| Exclude IP | !(ip.addr == 10.10.42.1) |
| IP Range | ip.addr >= 10.10.42.1 and ip.addr <= 10.10.42.100 |
| Subnet | ip.addr == 10.10.42.1/24 |
| Protocol Filter | http or ftp or ssh or icmp |
| TCP port | tcp.port == 25 |
| Destination TCP port | tcp.dst == 27 |
| IP and port | ip.addr == 10.10.50.1 and tcp.port == 25 |
| Timestamp | frame.time >= "2025-08-07 12:48:22" |
| SYN flag | tcp.flags.syn == 1 && tcp.flags.ack == 0 |
| HTTP Host | http.host == "example.com" |
| Broadcast traffic | eth.dst == ff:ff:ff:ff:ff:ff |
| Multicast traffic | (eth.dst[0] & 1) |
| MAC address | eth.addr == 00:10:f7:23:12:c5 |
Common Capture Filter Expressions
| Use Case | Filter Expression |
|---|---|
| Capture all traffic from a host. | src host 192.168.1.10 |
| Capture all traffic to a host. | dst host 8.8.8.8 |
| Capture any traffic to and from a host. | host 192.168.1.1 |
| Capture specific port traffic. | port 443 |
| Only capture TCP traffic. | tcp |
| Only capture UDP traffic. | udp |
| Only capture DNS traffic (UDP port 53). | udp port 53 |
| Capture ICMP (ping) traffic | icmp |
| Capture HTTP traffic. | tcp port 80 |
| Capture HTTPS traffic. | tcp port 443 |
| Capture traffic from a network. | net 192.168.1.0/24 |
| Exclude SSH traffic. | not port 22 |
Basic tshark Command Examples
| Command | Description |
|---|---|
tshark -D | List all available interfaces. |
tshark -i enp0s3 | Capture packets on a specific interface. |
tshark -i enp0s3 -w capturefile.pcapng | Save captured packets to a file. |
tshark -a duration:30 -i enp0s3 | Capture traffic for 30 seconds. |
tshark -f "port 443" -i enp0s3 | Apply a capture filter to record HTTPS traffic only. |
tshark -Y "http" -r capturefile.pcapng | Apply a display filter to show HTTP traffic from a saved file. |
tshark -T fields -e ip.src -e ip.dst | Output only specific fields (the source and destination IP in this example). |
tshark -z io,stat,1 | Show I/O statistics in 1-second intervals. |
tshark -z conv,tcp | Display TCP conversations. |
Advanced tshark Command Examples
| Command | Description |
|---|---|
tshark -i enp0s3 -c 100 -w capturefile.pcapng | Capture 100 packets and stop automatically. |
tshark -i enp0s3 -w capturefile.pcapng -P | Show packets live in the terminal and write them to a file. |
tshark -r capturefile.pcapng -Y "http.request" | Filter and display only HTTP requests from a capture file. |
tshark -r capturefile.pcapng -T fields -e ip.src -e ip.dst -e frame.len | Display the selected fields (source IP, destination IP, frame size). |
tshark -r capturefile.pcapng -T fields -e ip.src -e ip.dst -E header=y -E separator=, > packets.csv | Exports selected fields as a CSV file. |
tshark -r capturefile.pcapng -T json | Output data in a structured JSON format. |
tshark -r capturefile.pcapng -Y "dns" -T fields -e dns.qry.name | Extracts domain names from DNS query packets. |
tshark -i enp0s3 -f "tcp[tcpflags] & tcp-syn != 0" -c 10 | Capture 10 TCP SYN packets to identify connection attempts. |
tshark -i enp0s3 -f "host 192.168.1.10" | Capture traffic to and from a specific IP address. |
tshark -i enp0s3 -w capturefile.pcapng & | Start a capture in the background. |
tshark -qz io,stat,1 -i enp0s3 -a duration:60 | Print packet counts per second over 60 seconds. |
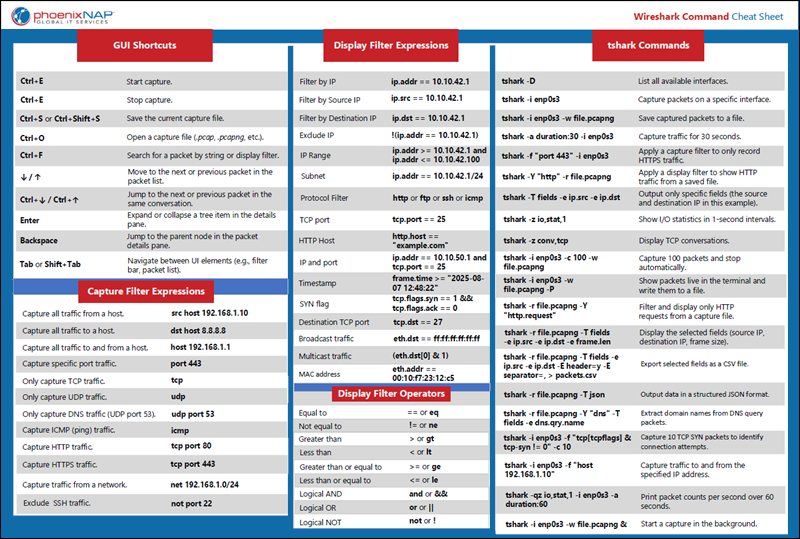
Wireshark Cheat Sheet
Download the Wireshark Commands Cheat Sheet in PDF format. Use this one-page reference sheet to access essential Wireshark and tshark commands whenever you need them.
Conclusion
This tutorial showed you how to use Wireshark to capture network packets, navigate the interface, and customize capture settings. This guide also provides a handy, downloadable cheat sheet with essential commands and options.
Try pairing Wireshark with an active port scanner like Nmap to see how it probes different ports during a scan and interacts with your network in real time.