The ELK stack is a set of applications for retrieving and managing log files. It is a collection of three open-source tools: Elasticsearch, Kibana, and Logstash. The stack can be further upgraded with Beats, a lightweight plugin for aggregating data from different data streams.
In this tutorial, learn how to install the ELK software stack on Ubuntu.

Prerequisites
- An Ubuntu-based system (this guide uses Ubuntu 24.04).
- Command-line access.
- A user account with sudo permissions.
Setting up ELK Stack on Ubuntu
To set up the ELK stack on Ubuntu, you need to install and configure each component individually.
Note: You do not have to install Java on Ubuntu in advance because the latest Elastic versions have a bundled version of OpenJDK. If you prefer a different version or have a pre-installed Java version, confirm it is compatible by checking the Elastic compatibility matrix.
Step 1: Add Elastic Repository to Ubuntu System Repositories
By adding the official Elastic repository, you gain access to the latest versions of all the open-source software in the ELK stack.
Update GPG Key
Before adding the Elastic repository to your Ubuntu system, import the GPG key to verify the source. Open a terminal window and use the wget command to retrieve and save the public key:
wget -qO - https://artifacts.elastic.co/GPG-KEY-elasticsearch | sudo gpg --dearmor -o /usr/share/keyrings/elasticsearch-keyring.gpg
Add Elastic Repository
Add the repository to your system's apt sources list. This tells the Ubuntu apt package manager where to find Elastic:
echo "deb [signed-by=/usr/share/keyrings/elasticsearch-keyring.gpg] https://artifacts.elastic.co/packages/8.x/apt stable main" | sudo tee /etc/apt/sources.list.d/elastic-8.x.list
The command above retrieves keys for Elastic version 8.x. If a newer version is available, adjust the command accordingly.
Step 2: Install Elasticsearch on Ubuntu
You can install Elasticsearch using the apt command. After the installation, the apt package manager will automatically handle dependencies and future updates.
Install Elasticsearch
Open a terminal window and update the Ubuntu package index:
sudo apt updateInstall Elasticsearch from the repository using the following command:
sudo apt install elasticsearch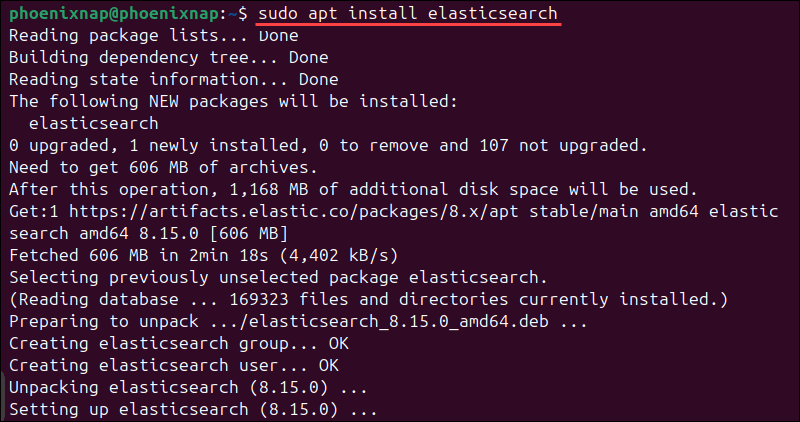
The package manager downloads and installs Elasticsearch on your system. Be patient, as the process can take a few minutes to complete.
Enable and Start Elasticsearch
Reload the systemd manager configuration to ensure it recognizes Elasticsearch:
sudo systemctl daemon-reloadEnable the Elasticsearch service to start every time the system boots:
sudo systemctl enable elasticsearch.service
Use the following command to start Elasticsearch:
sudo systemctl start elasticsearch.serviceThere is no output if the service starts successfully.
Configure Elasticsearch (Optional)
By default, Elasticsearch listens on localhost:9200 for connections. This setting is sufficient for the purposes of this tutorial, so we will not be modifying default Elasticsearch settings.
However, users who need to access Elasticsearch remotely via SSH or plan to run a distributed, multi-node cluster must edit the elasticsearch.yml configuration file.
Use the following command to access the YAML file:
sudo nano /etc/elasticsearch/elasticsearch.ymlThis file is organized into sections that control different aspects of Elasticsearch's behavior. For example, the Paths section contains directory paths that tell Elasticsearch where to store index data and logs, while the Network section contains settings related to internet connectivity.
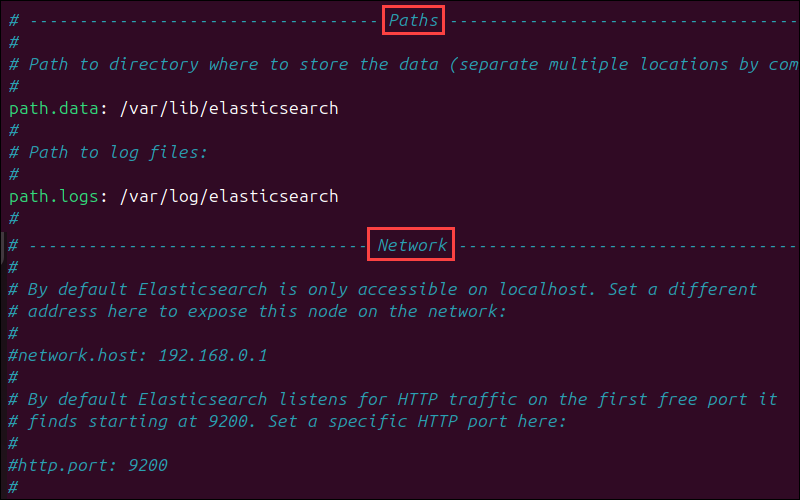
Lines that contain setting parameters are typically commented out, which means the system ignores them. To activate a setting, remove the hash (#) symbol at the beginning of the line you want the system to apply.
You can replace the default parameter values with your custom values if needed. For example, to set Elasticsearch to listen on a non-loopback IP address and a custom port number, uncomment the network.host and http.port lines and enter the custom values.
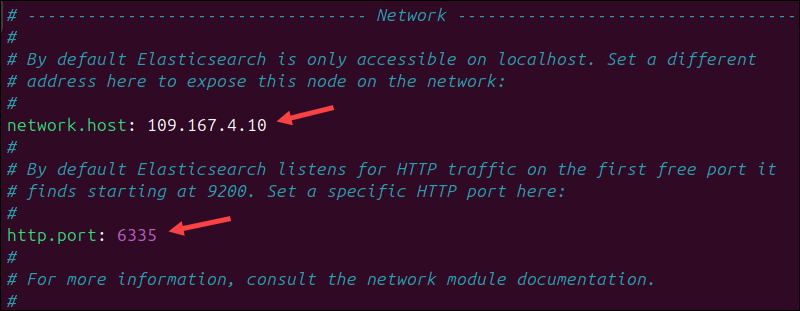
After making changes to the Elasticsearch configuration file, it's essential to restart the service to apply the new settings. Enter the following command to restart the Elasticsearch service:
sudo systemctl restart elasticsearch.serviceFor a more detailed explanation of Elasticsearch settings, refer to our Install Elasticsearch on Ubuntu guide.
Test Elasticsearch
Check the status of the Elasticsearch service:
sudo systemctl status elasticsearch.service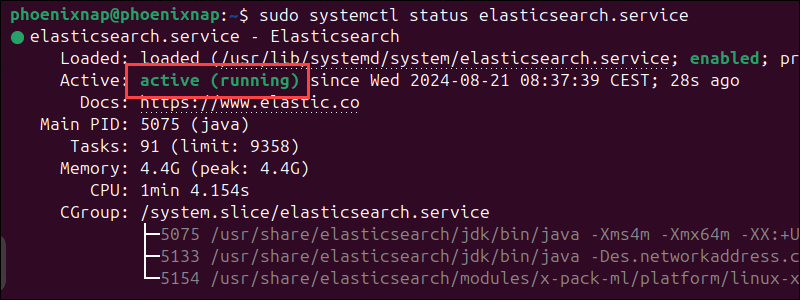
The output shows that the Elasticsearch service is active. Next, use the curl command to test the configuration:
curl -X GET "localhost:9200"If Elasticsearch is running correctly, the JSON response should contain the cluster name, version details, and other metadata:
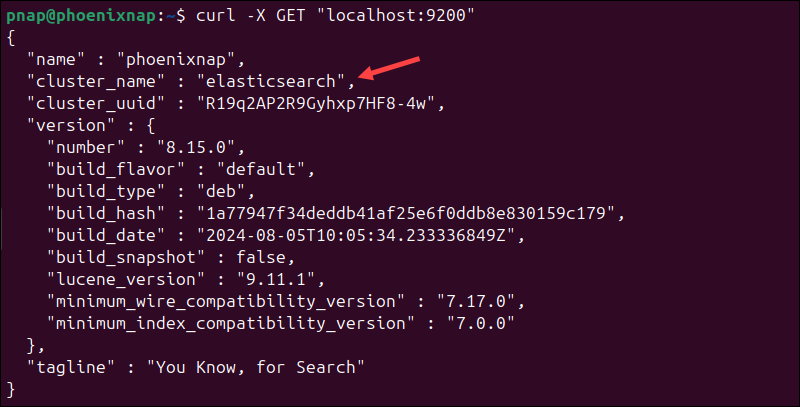
This indicates that Elasticsearch is functional and is listening on port 9200.
Step 3: Install Kibana on Ubuntu
Kibana is a graphical user interface (GUI) within the Elastic stack. It allows you to parse, visualize, and interpret collected log files and manage the entire stack in a user-friendly environment.
Install Kibana
Enter the following command to install Kibana:
sudo apt install kibana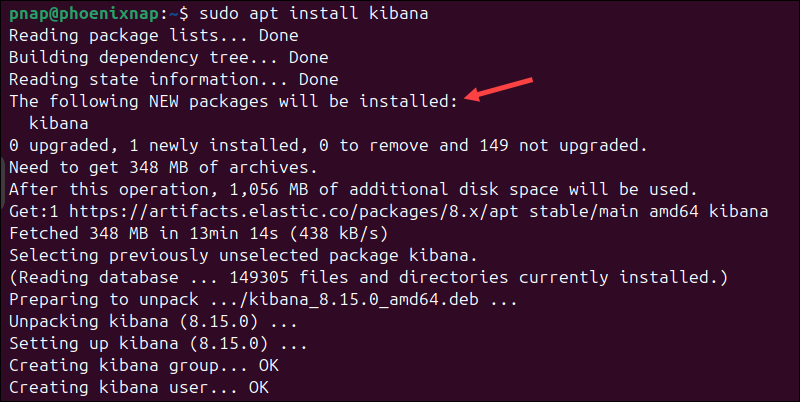
The installation process may take several minutes.
Enable and Start Kibana
Configure Kibana to launch automatically at system boot:
sudo systemctl enable kibana
Enter the following command to start the Kibana service:
sudo systemctl start kibanaThere is no output if the service starts successfully.
Allow Traffic on Port 5601
If the UFW firewall is enabled on your Ubuntu system, you must allow traffic on port 5601 to access the Kibana dashboard.
Enter the following command to allow traffic on the default Kibana port:
sudo ufw allow 5601/tcp
The output confirms that UFW rules have been updated.
Test Kibana
To access Kibana, open a web browser and navigate to:
http://localhost:5601The Kibana dashboard loads.
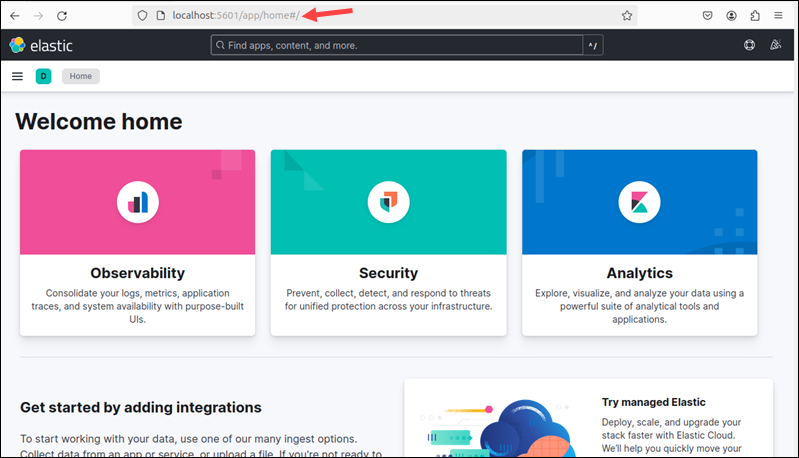
Note: If you receive a Kibana server not ready yet error, check if the Elasticsearch and Kibana services are active.
With the current settings, any user with access to the local machine can also access the Kibana dashboard. To prevent unauthorized users from accessing Kibana and the data in Elasticsearch, you can set up an Nginx reverse proxy.
Secure Kibana (Optional)
Nginx works as a web server and proxy server. Its reverse proxy feature lets you configure password-protected access to the Kibana dashboard.
1. Install Nginx on Ubuntu by entering the following command:
sudo apt install nginx -y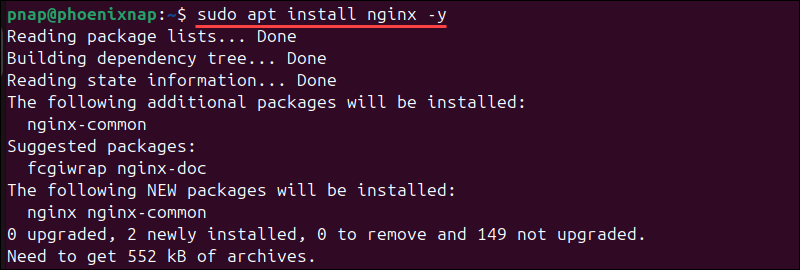
2. Install the apache2-utils utility for creating password-protected accounts:
sudo apt install apache2-utils -y
3. Use the following command to create a user account for accessing Kibana:
sudo htpasswd -c /etc/nginx/htpasswd.users [username]
Replace [username] with a Kibana username and enter and confirm the password when prompted.
4. Use a text editor, such as Nano, to create a Nginx configuration file for Kibana:
sudo nano /etc/nginx/sites-available/kibana5. Add the following content to the kibana configuration file:
server {
    listen 80;
    server_name localhost;
    location / {
        auth_basic "Restricted Access";
        auth_basic_user_file /etc/nginx/htpasswd.users;
        proxy_pass http://localhost:5601;
        proxy_set_header Host $host;
        proxy_set_header X-Real-IP $remote_addr;
        proxy_set_header X-Forwarded-For $proxy_add_x_forwarded_for;
        proxy_set_header X-Forwarded-Proto $scheme;
    }
}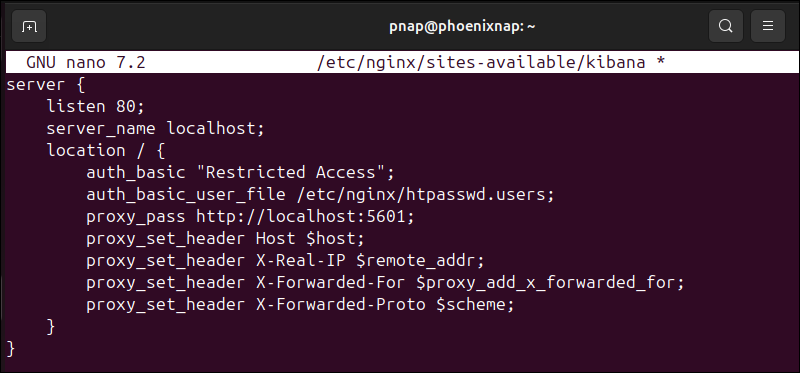
The configuration controls access and authenticates users based on the credentials stored in the /etc/nginx/htpasswd.users file. It listens on port 80 and routes localhost requests to the Kibana dashboard on port 5601.
6. Press Ctrl+X, followed by Y, and then Enter to save the changes and exit Nano.
7. Create a symbolic link to the file in the /etc/nginx/sites-enabled/ directory to activate the configuration:
sudo ln -s /etc/nginx/sites-available/kibana /etc/nginx/sites-enabled/8. Test the Nginx configuration syntax:
sudo nginx -t
"The message syntax is ok" indicates that the test was successful.
9. Reload the systemd manager configuration to ensure it recognizes the changes:
sudo systemctl daemon-reload10 . Restart the Nginx and Kibana services to apply the changes:
sudo systemctl restart nginxsudo systemctl restart kibanaWhen the services are restarted, Nginx will begin directing requests to Kibana, enforcing the configured authentication, and allowing access only to authorized users.
Test Kibana Authentication (Optional)
Open a web browser and go to the IP address assigned to Kibana. If you use the default settings, the address is:
http://localhostAn authentication window will appear. Enter the credentials you created during the Nginx setup and click Sign In.
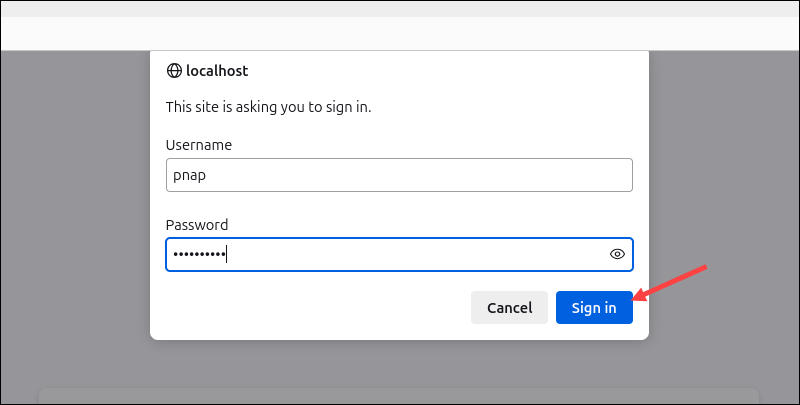
If the credentials are correct, the browser opens the Elastic welcome page on localhost.
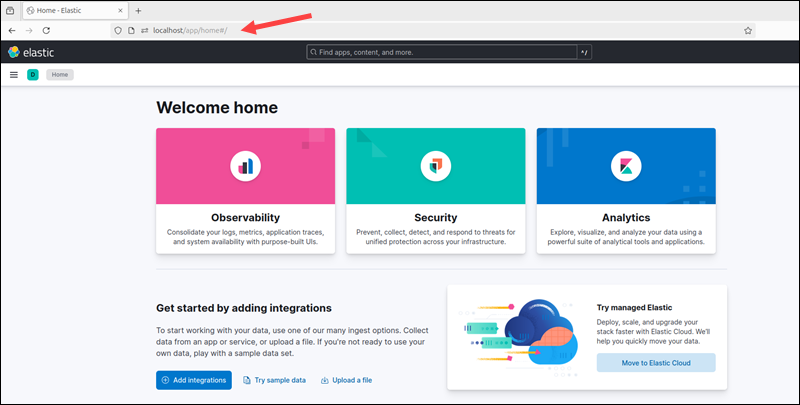
This confirms that the reverse proxy settings and credentials work.
Step 4: Install Logstash on Ubuntu
Logstash collects, processes, and transforms data from multiple sources before storing it in Elasticsearch. Users can then visualize and analyze the processed data within the Kibana dashboard.
Install Logstash
Enter the following command to install Logstash:
sudo apt install logstashEnable and Start Logstash
Enable the Logstash service to start automatically at system boot:
sudo systemctl enable logstashStart the Logstash service:
sudo systemctl start logstashTo check the status of the service, run the following command:
sudo systemctl status logstash
The active message indicates that the service is working.
Configure Logstash
Logstash is a highly customizable part of the ELK stack. Once installed, you can configure its input, filters, and output pipelines according to your specific use case.
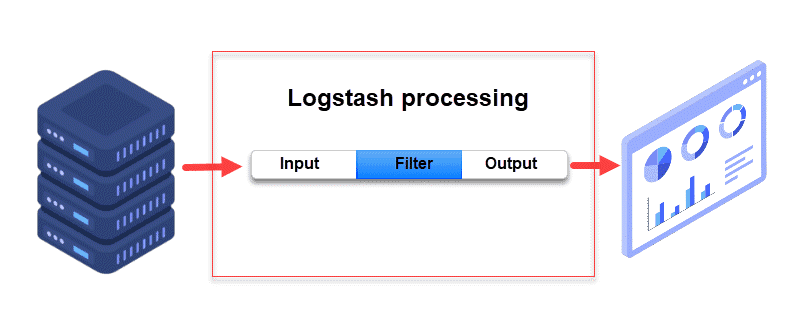
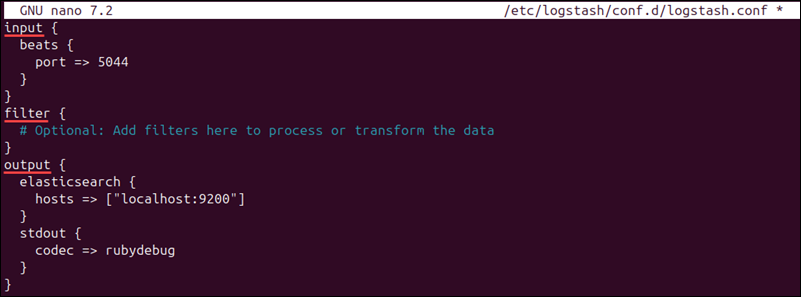
Logstash does not output data to Elasticsearch by default. Users must explicitly define an output block in the configuration file to direct Logstash to send data to Elasticsearch. Since this tutorial also explains how to install Filebeat, Logstash must be configured to receive data from Filebeat.
On most systems, custom Logstash configuration files are stored in /etc/logstash/conf.d/ directory. Follow these steps:
1. Create a Logstash configuration file:
sudo nano /etc/logstash/conf.d/logstash.conf2. This is an example configuration that contains input, filter, and output blocks:
input {
  beats {
    port => 5044
  }
}

filter {
  # Optional: Add filters here to process or transform the data
}

output {
  elasticsearch {
    hosts => ["localhost:9200"]
  }
  stdout {
    codec => rubydebug
  }
}- input. Specifies the input source. The configuration above tells Logstash to listen on port
5044for data from Filebeat. - filter. An optional block that adds filters that process or transform data sent by Filebeat.
- output. This block instructs Logstash to send processed data to an Elasticsearch instance running on
localhostat port9200. In addition, thestdoutsection outputs the data to the console in a readable format. This option is handy when debugging, but can be disabled in a production environment.
3. Save the changes and exit the configuration file.
4. Restart the Logstash service to apply the changes:
sudo systemctl restart logstashNote: Consider the following Logstash configuration examples and use them to adjust Logstash settings for your use case.
Step 5: Install Filebeat on Ubuntu
Filebeat is a lightweight Beats module that collects and ships log files to Logstash or Elasticsearch. If the Logstash service becomes overwhelmed, Filebeat will automatically throttle data streams.
Note: Make sure that the Kibana service is up and running during the Filebeat installation and configuration process.
Install Filebeat
Install Filebeat by running the following command:
sudo apt install filebeat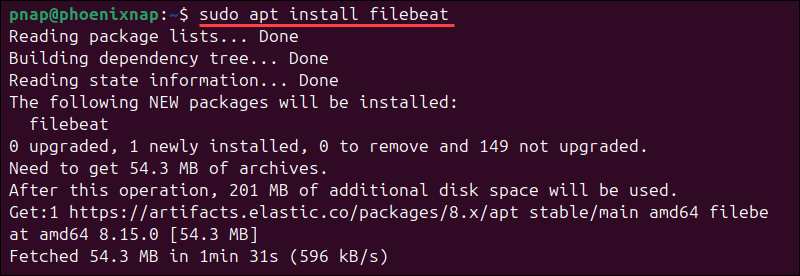
The installation takes several minutes to complete.
Allow Traffic on Port 5044
If the UFW firewall is enabled, open traffic on port 5044 to allow Filebeat and Logstash to communicate:
sudo ufw allow 5044/tcp
The output confirms that ufw rules have been updated.
Configure Filebeat
You need to configure Filebeat to ensure it sends data to the correct components in the Elastic stack.
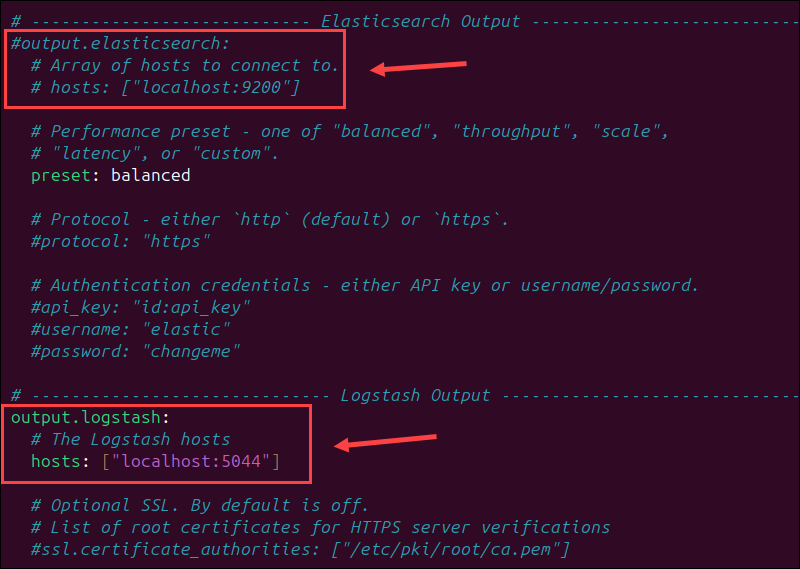
Filebeat, by default, sends data to Elasticsearch. To adjust the configuration and send data to Logstash for processing before it reaches Elasticsearch, you need to edit the filebeat.yml configuration file. Follow these steps:
1. Open the filebeat.yml file:
sudo nano /etc/filebeat/filebeat.yml2. Comment out or remove the Elasticsearch output section:
# output.logstash
     #Array of hosts to connect to.
     # hosts: ["localhost:5044"]
3. Uncomment the Logstash output section:
output.logstash
     hosts: ["localhost:5044"]
For further details, see the image below.
4. Save the changes and exit the file.
5. Enable the Filebeat system module to collect and parse local system logs:
sudo filebeat modules enable system
The Enabled system message confirms the module is enabled.
6. Enter the following command to load the index template into Elasticsearch:
sudo filebeat setup --index-management -E output.logstash.enabled=false -E output.elasticsearch.hosts=["localhost:9200"]This command temporarily directs Filebeat to connect directly to Elasticsearch to load the necessary index templates. After this, Filebeat resumes sending logs to Logstash as set in the configuration file.

Note: If you receive a message stating that an ILM policy already exists and will not be overwritten, you can safely ignore it. The index template is still going to be loaded.
Enable and Start Filebeat
Enable Filebeat to start automatically on system boot:
sudo systemctl enable filebeat
Start the Filebeat service:
sudo systemctl start filebeatThere is no output if the service starts successfully.
Verify Elasticsearch Reception of Data
To verify that Filebeat is successfully shipping log files to Logstash and that the data is being processed and sent to Elasticsearch, check the indices in your Elasticsearch cluster:
curl -XGET http://localhost:9200/_cat/indices?v
The output displays a list of indices, their health status, document count, and size.
Note: For further details on health status indicators, please see Elastic's Cluster Health documentation.
Conclusion
You now have a functional ELK stack installed on your Ubuntu system. Start customizing this powerful monitoring tool to meet your specific needs.
If you work in distributed environments with Docker, check out our ELK Stack on Docker guide.


