The ELK stack is a group of open-source software packages used to manage logs. It’s typically used for server logs but is also flexible (elastic) for any project that generates large sets of data.
This guide shows you how to install the ELK stack (Elasticsearch, Logstash, and Kibana) on CentOS 8 server.

Prerequisites
- A system with CentOS 8 installed
- Access to a terminal window/command line (Search > Terminal)
- A user account with sudo or root privileges
- Java version 8 or 11 (required for Logstash)
What Does the ELK Stack Stand For?
ELK stands for Elasticsearch, Logstash, and Kibana. They are the three components of the ELK stack.
Elasticsearch (indexes data) – This is the core of the Elastic software. Elasticsearch is a search and analytics engine used to sort through data.
Logstash (collects data) – This package connects to various data sources, collates it, and directs it to storage. As its name suggests, it collects and “stashes” your log files.
Kibana (visualizes data) – Kibana is a graphical tool for visualizing data. Use it to generate charts and graphs to make sense of the raw data in your databases.
Note: At the time of writing this article, the latest version of Elasticsearch is 7.6.2. All packages of the ELK stack must be the same version for the stack to function properly.
Step 1: Install OpenJDK 8 Java
If you already have Java 8 (or 11) installed on your system, you can skip this step.
Otherwise, open a terminal window, and enter the following:
sudo yum install java-1.8.0-openjdkThe system will check the repositories, then prompt you to confirm the installation. Type Y then Enter. Allow the process to complete.

Note: For a detailed guide, refer to How to Install Java on CentOS 8.
Step 2: Add Elasticsearch Repositories
The ELK stack can be downloaded and installed using the YUM package manager. However, the software isn’t included in the default repositories.
Import the Elasticsearch PGP Key
Open a terminal window, then enter the following code:
sudo rpm ––import https://artifacts.elastic.co/GPG-KEY-elasticsearch
This will add the Elasticsearch public signing key to your system. This key will validate the Elasticsearch software when you download it.
Add the Elasticsearch RPM Repository
You need to create the repository config file in /etc/yum.repos.d/. Start by moving into the directory:
cd /etc/yum.repos.d/Next, create the config file in a text editor of your choice (we’are using Vim):
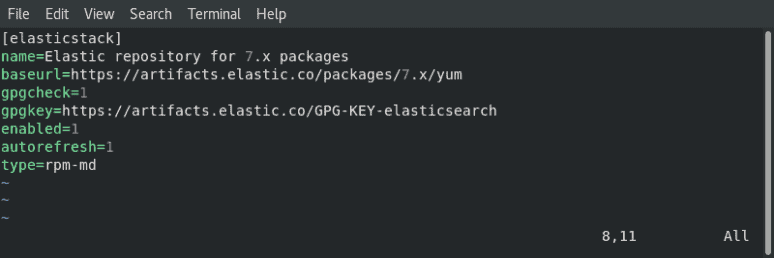
sudo vim elasticsearch.repoType or copy the following lines:
[elasticstack]
name=Elastic repository for 7.x packages
baseurl=https://artifacts.elastic.co/packages/7.x/yum
gpgcheck=1
gpgkey=https://artifacts.elastic.co/GPG-KEY-elasticsearch
enabled=1
autorefresh=1
type=rpm-md
If using Vim, press Esc then type :wq and hit Enter.
Finally, update your repositories’ package lists:
dnf updateNote: This repository grants access to the whole ELK stack.
Step 3: Install and Set Up Elasticsearch
The order of installation is important. Start by installing Elasticsearch.
In a terminal window, type in the command:
sudo dnf install elasticsearchThis will scan all your repositories for the Elasticsearch package.
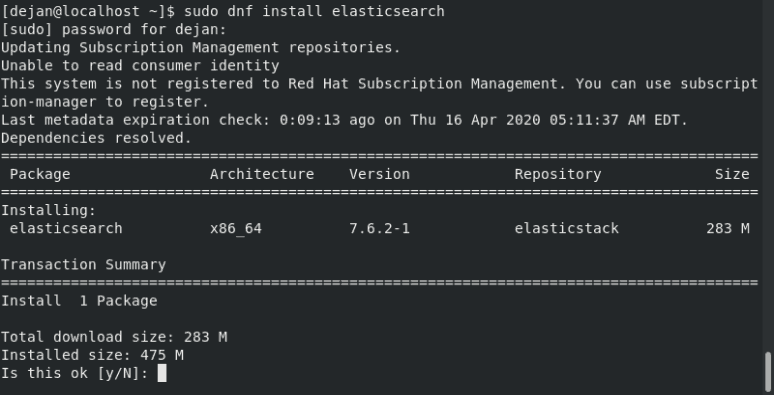
The system will calculate the download size, then prompt you to confirm the installation. Type Y then Enter.
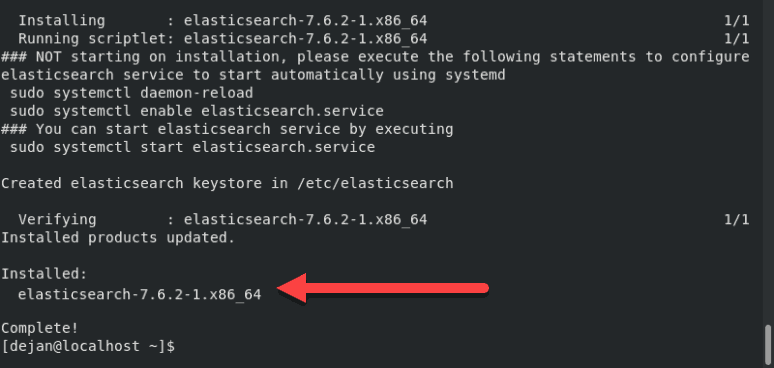
Configure Elasticsearch
Once the installation finishes, open and edit the /etc/elasticsearch/elasticsearch.yml configuration file using a text editor:
sudo vim /etc/elasticsearch/elasticsearch.ymlScroll down to the section labeled NETWORK. Below that entry, you should see the following lines:
# Set the bind address to a specific IP (IPv4 or IPv6):
#
#network.host: 192.168.0.1
#
# Set a custom port for HTTP:
#
#http.port: 9200
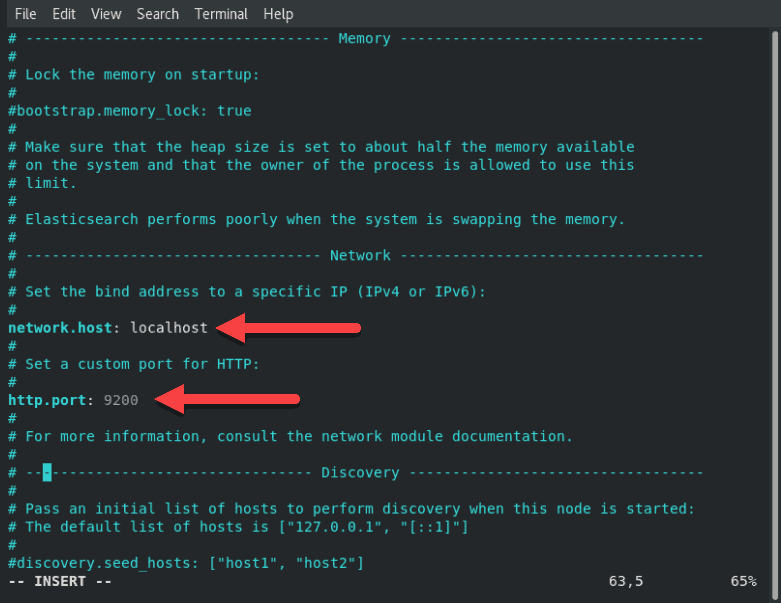
Adjust the network.host to your server’s IP address or set it to localhost if setting up a single node locally. Adjust the http.port as well.
# Set the bind address to a specific IP (IPv4 or IPv6):
#
network.host: localhost
#
# Set a custom port for HTTP:
#
http.port: 9200
For further details, see image below:
If using Vim, press ESC, type :wq and hit Enter to save the changes and exit.
Start Elasticsearch
Reboot the system for the changes to take effect:
sudo rebootOnce the system restarts, start the elasticsearch service:
sudo systemctl start elasticsearchThere will be no output if the command was executed correctly.
Now, set the service to launch at boot:
sudo systemctl enable elasticsearch
Test Elasticsearch
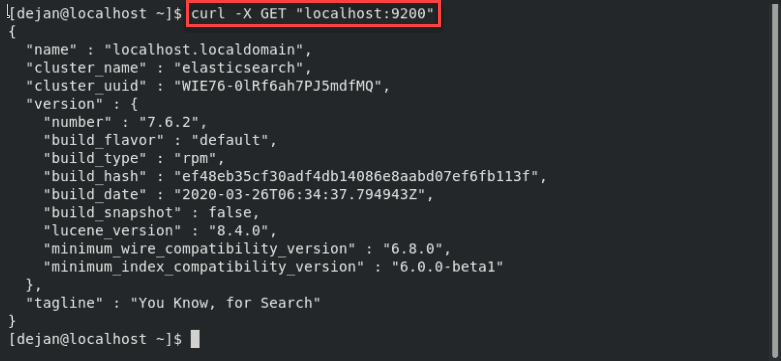
Test the software to make sure it responds to a connection:
curl -X GET "localhost:9200"The system should display a whole list of information. On the second line, you should see that the cluster_name is set to elasticsearch. This confirms that Elasticsearch is running, and listening on Port 9200.
Step 4: Install and Set Up Kibana
Kibana is a graphical interface for parsing and interpreting log files.
Kibana uses the same GPG key as Elasticsearch, so you don’t need to re-import the key. Additionally, the Kibana package is in the same ELK stack repository as Elasticsearch. Hence, there is no need to create another repository configuration file.
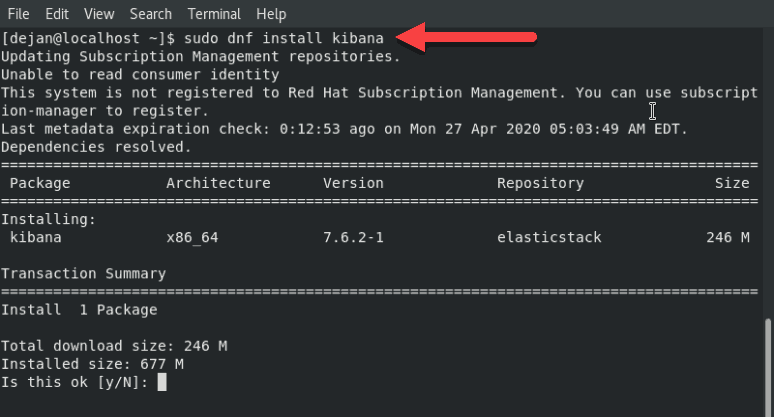
To install Kibanra, open a terminal window, enter the following:
sudo dnf install kibanaThe system will scan the repositories, then prompt for confirmation. Type y then Enter and allow the process to finish.
Configure Kibana
Like Elasticsearch, you’ll need to edit the .yml configuration file for Kibana.
Open the kibana.yml file for editing:
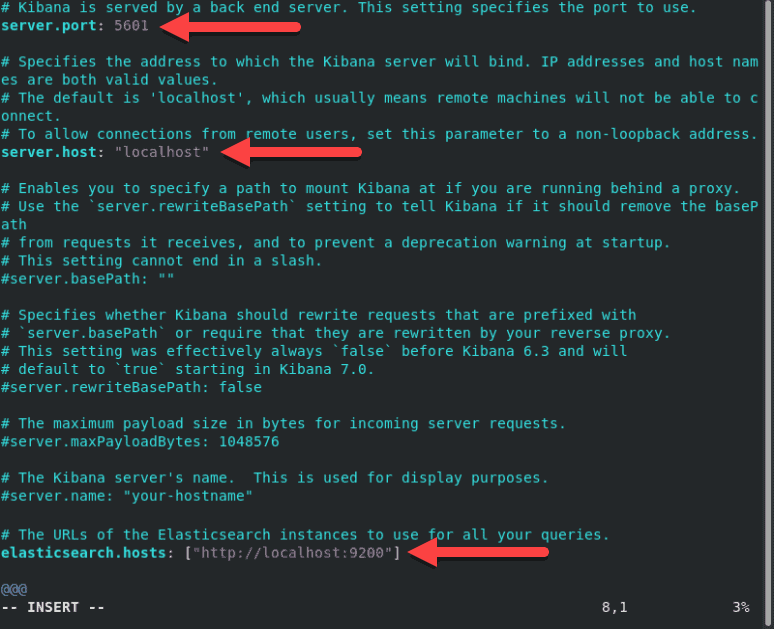
sudo vim /etc/kibana/kibana.ymlFind the following lines, and remove the # sign from the beginning of the line:
#server.port: 5601#server.host: "localhost"#elasticsearch.hosts: ["http://localhost:9200"]The lines should now look as follows:
server.port: 5601server.host: "localhost"elasticsearch.hosts: ["http://localhost:9200"]For further details, see image below.
To assign a custom name, edit the server.name line.
Make any other edits as desired. Save the file and exit (press Esc, type :wq and press Enter).
Note: The elasticsearch.hosts line may be listed as elasticsearch.url in some older versions. Also, your system may substitute 127.0.0.1:9200 for the localhost:9200 line. They both refer to the system you’re working on.
Start and Enable Kibana
Next, start and enable the Kibana service:
sudo systemctl start kibanasudo systemctl enable kibana
Allow Traffic on Port 5601
If firewalld is enabled on your CentOS system, you need to allow traffic on port 5601. In a terminal window, run the following command:
firewall-cmd --add-port=5601/tcp --permanentNext, reload the firewalld service:
firewall-cmd --reloadThe above action is a prerequisite if you intend to access the Kibana dashboard from external machines.
Test Kibana
Open a web browser, and enter the following address:
http://localhost:5601The system should start loading the Kibana dashboard.

Step 5: Install and Set Up Logstash
Logstash is a tool that collects data from different sources. The data it collects is parsed by Kibana and stored in Elasticsearch.
Like other parts of the ELK stack, Logstash uses the same Elastic GPG key and repository.
To install logstash on CentOS 8, in a terminal window enter the command:
sudo dnf install logstash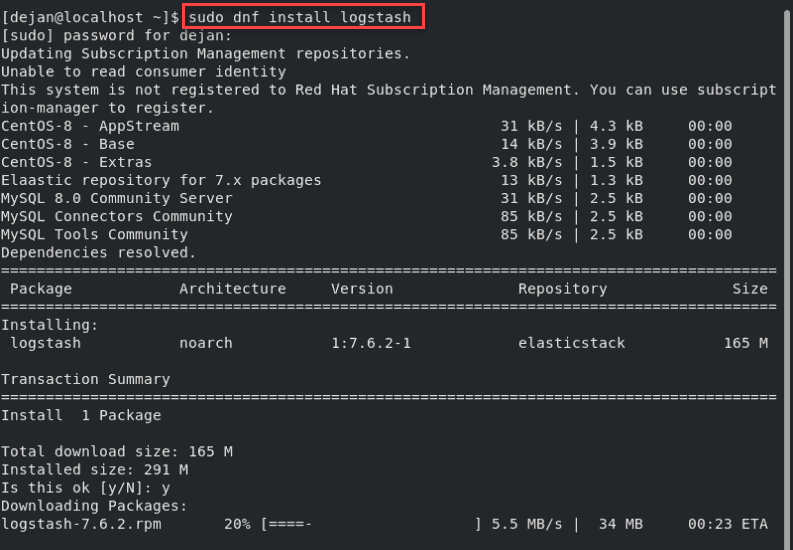
Type Y and hit Enter to confirm the install.
Configure Logstash
Store all custom configuration files in the /etc/logstash/conf.d/ directory. The configuration largely depends on your use case and plugins used.
For examples of custom configurations, refer to Logstash Configuration Examples.
Start Logstash
Start and enable the Logstash service:
sudo systemctl start logstashsudo systemctl enable logstash
You should now have a working installation of Elasticsearch, along with the Kibana dashboard and the Logstash data collection pipeline.
Step 6: Install Filebeat
To simplify logging, install a lightweight module called Filebeat. Filebeat is a shipper for logs that centralizes data streaming.
To install Filebeat, open a terminal window and run the command:
sudo yum install filebeat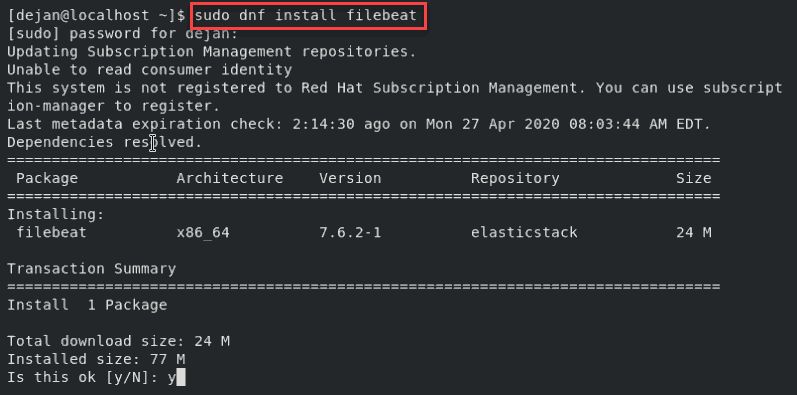
Note: Make sure that the Kibana service is up and running during the installation procedure.
Next, add the system module, which will examine the local system logs:
sudo filebeat modules enable systemNext, run the Filebeat setup:
sudo filebeat setupThe system will do some work, scanning your system and connecting to your Kibana dashboard.
Start the Filebeat service:
sudo service filebeat start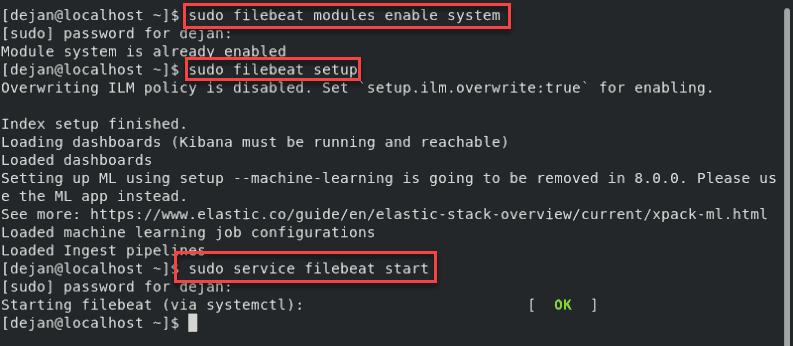
Launch your Kibana dashboard in a browser by visiting the following address:
http://localhost:5601On the left column, click the Logs tab. Find and click the Stream live link. You should now see a live data stream for your local log files.
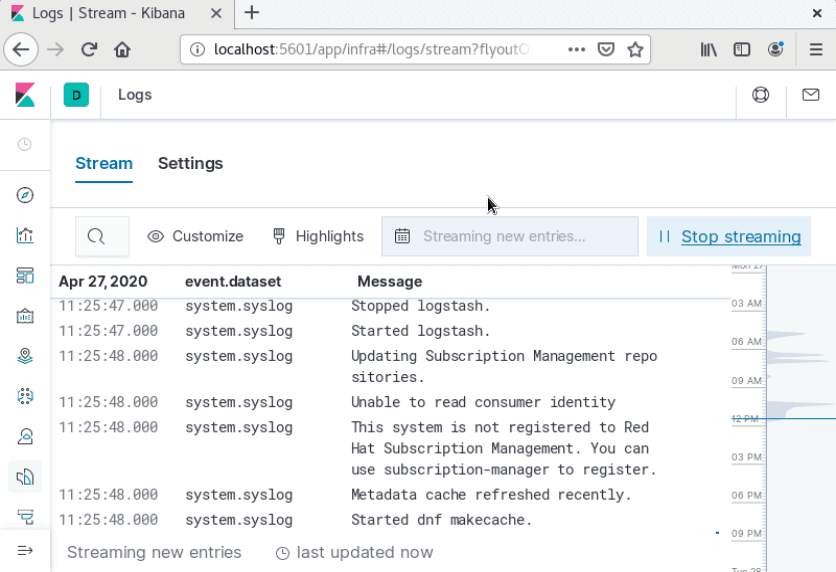
Note: By default, Filebeat logs files directly into Elasticsearch. To customize Filebeat, edit the /etc/filebeat/filebeat.yml config file. For custom configuration options, refer to Filebeat ‘s official documentation.
Conclusion
You should now have ELK stack installed on your CentOS 8 system.
The ELK stack is often used to gather, search, analyze, and display information about IT environments.
Elasticsearch and its related tools are very powerful for monitoring logs. You can use Logstash to configure inputs and outputs, filter data, and customize data streams. Use Kibana for easy browsing through log files.


