Prometheus is an open-source event monitoring software for high-volume distributed applications. It features real-time metrics and alerting, flexible queries, an HTTP pull model, and is a good choice for monitoring Kubernetes clusters.
While Prometheus is a stand-alone application, using it with a visualization dashboard helps maintain a better overview of a Kubernetes cluster. A popular choice for this scenario is Grafana, an open-source visualization software, which supports Prometheus as a data source out-of-the-box.
This tutorial will show you how to install Grafana in your Kubernetes cluster, connect it to Prometheus and organize data in dashboards.

Prerequisites
- Kubernetes cluster
- kubectl command-line tool installed
- Prometheus installed and set up
Install Grafana
To install Grafana on a Kubernetes cluster, create and apply a series of yaml files.
1. Start by creating a ConfigMap in a file titled grafana-datasource-config.yaml:
nano grafana-datasource-config.yamlThe file consists of the following declarations:
apiVersion: v1
kind: ConfigMap
metadata:
 name: grafana-datasources
 namespace: default
data:
  prometheus.yaml: |-
    {
        "apiVersion": 1,
        "datasources": [
            {
               "access":"proxy",
                "editable": true,
                "name": "prometheus",
                "orgId": 1,
                "type": "prometheus",
                "url": "http://prometheus-service.monitoring.svc:9090",
                "version": 1
            }
        ]
    }
2. Adjust the file’s contents to fit your needs by specifying the namespace you wish to install Grafana in.
3. Save and exit the file.
4. Apply changes to your cluster using kubectl:
kubectl create -f grafana-datasource-config.yamlThe output confirms the creation of the ConfigMap:

5. Next, create a yaml file for Grafana deployment:
nano deployment.yamlThe file contains the Grafana deployment configuration:
apiVersion: apps/v1
kind: Deployment
metadata:
  name: grafana
  namespace: default
spec:
  replicas: 1
  selector:
    matchLabels:
      app: grafana
  template:
    metadata:
      name: grafana
      labels:
        app: grafana
    spec:
      containers:
      - name: grafana
        image: grafana/grafana:latest
        ports:
        - name: grafana
          containerPort: 3000
        resources:
          limits:
            memory: "1Gi"
            cpu: "1000m"
          requests:
            memory: 500M
            cpu: "500m"
        volumeMounts:
          - mountPath: /var/lib/grafana
            name: grafana-storage
          - mountPath: /etc/grafana/provisioning/datasources
            name: grafana-datasources
            readOnly: false
      volumes:
        - name: grafana-storage
          emptyDir: {}
        - name: grafana-datasources
          configMap:
              defaultMode: 420
              name: grafana-datasources
6. Save the file, then apply it to the cluster:
kubectl create -f deployment.yamlThe output confirms the deployment creation:

7. Lastly, create the service.yaml file to configure Grafana service:
nano service.yamlThe file consists of the following declarations:
apiVersion: v1
kind: Service
metadata:
  name: grafana
  namespace: default
  annotations:
      prometheus.io/scrape: 'true'
      prometheus.io/port:   '3000'
spec:
  selector:
    app: grafana
  type: NodePort
  ports:
    - port: 3000
      targetPort: 3000
      nodePort: 32000
8. Adjust the file to the needs of your cluster, then save it and apply it:
kubectl create -f service.yamlThe output confirms the service was created successfully:

9. Use the kubectl port forwarding command to forward Grafana service to port 3000:
kubectl port-forward svc/grafana 3000
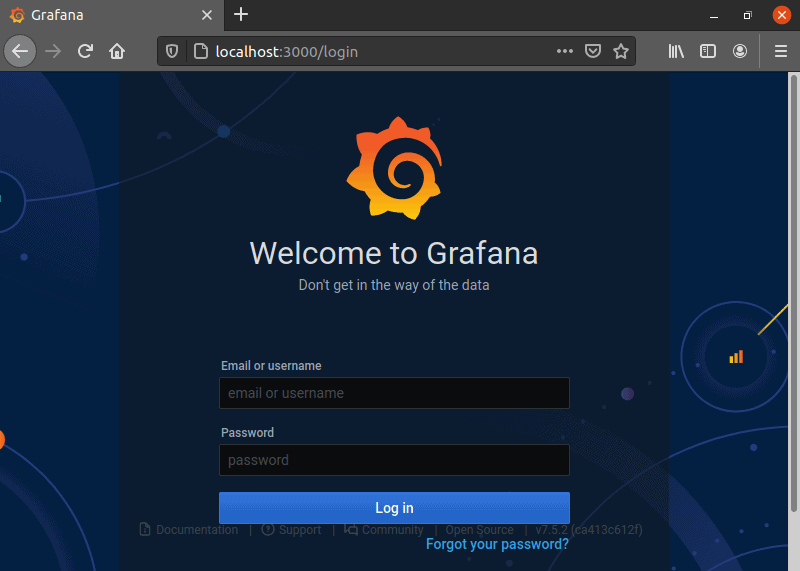
10. Now open a browser and navigate to http://localhost:3000/.
11. The Grafana login screen appears, asking for your username and password. Type admin in both fields and click Log in.
12. Grafana asks you to set a new password, after which the home page is shown.
Add Prometheus as a Grafana Data Source
To start working with Prometheus in Grafana, add Prometheus as a data source.
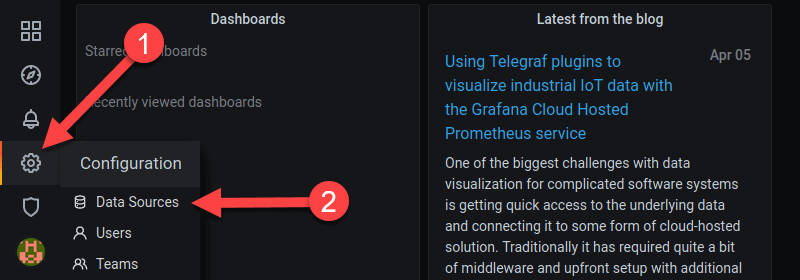
1. In the sidebar on the left, hover over the cogwheel icon to reveal the configuration submenu.
2. Click Data Sources.
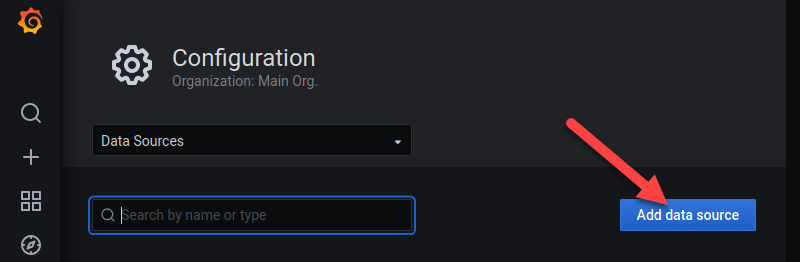
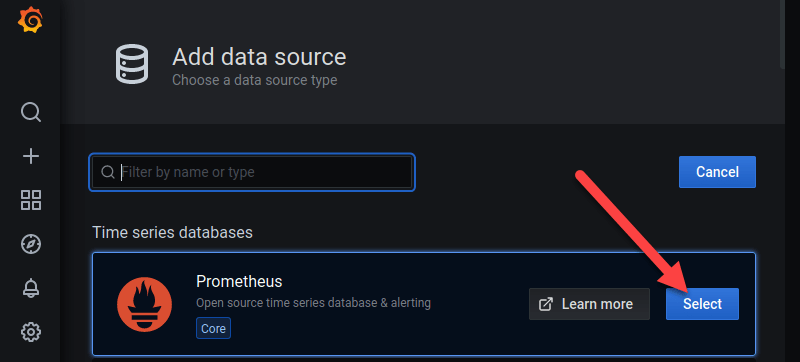
2. A configuration page opens. Click the Add data source button.
3. Select Prometheus as the data source type by clicking the Select button on the right.
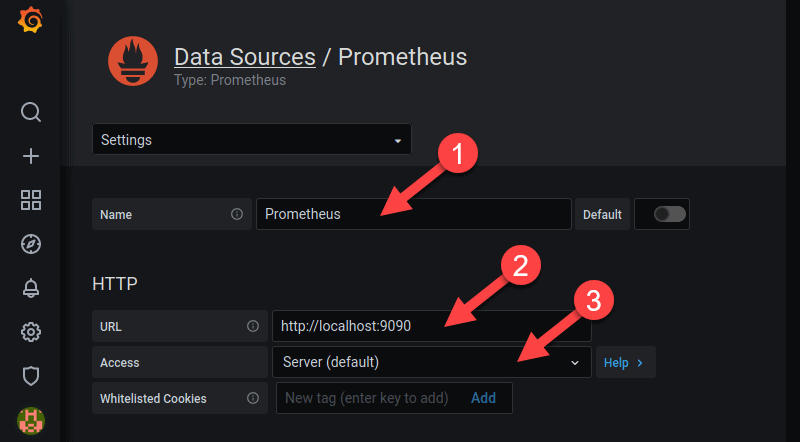
4. The configuration page for Prometheus opens. Here you specify the name of the source, the URL and port for the Prometheus service, and the type of access (server access is the default option).
5. Once you are done, scroll down to the bottom of the page and click the Save & Test button.
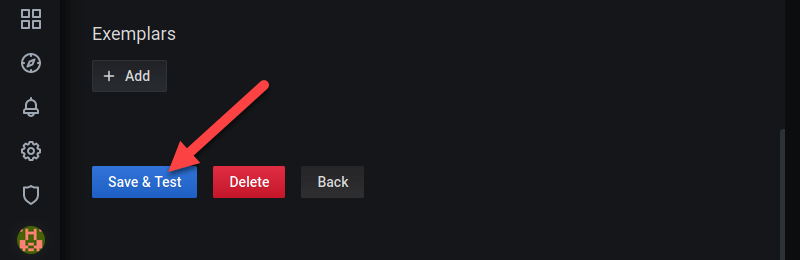
Grafana tests the connection with Prometheus and finishes adding the data source.
Note: If you receive the “Error Bad Gateway” error, try changing the HTTP Access option from Server to Browser.
Import Prometheus Stats as a Dashboard into Grafana
Grafana supports Prometheus out-of-the-box and you can easily access the premade Prometheus dashboard.
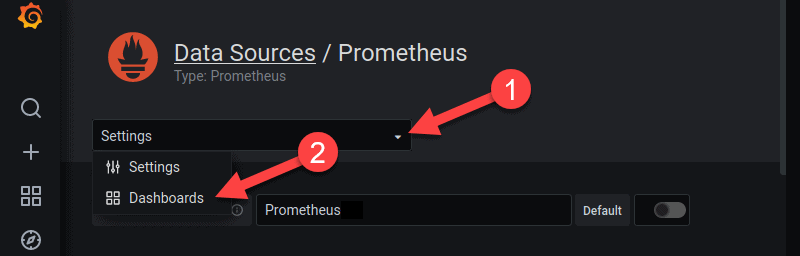
1. Navigate back to the Data Sources section and select Prometheus.
2. Open the Settings drop-down menu.
3. Then click Dashboards.
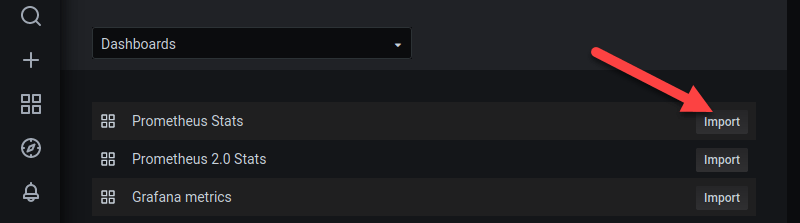
4. A list of available dashboards appears. Import the dashboard you want by clicking the Import button to the right of the dashboard name.
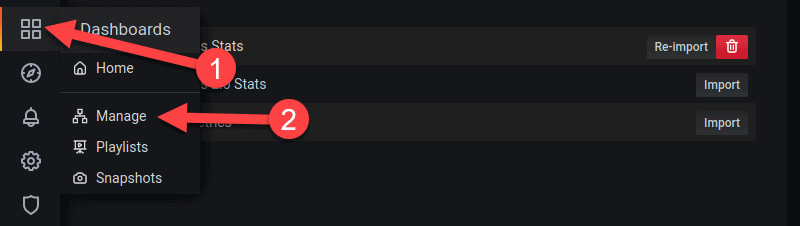
5. To access the dashboard, hover over the four-squares icon in the left sidebar to reveal the Dashboards menu.
6. Click Manage.
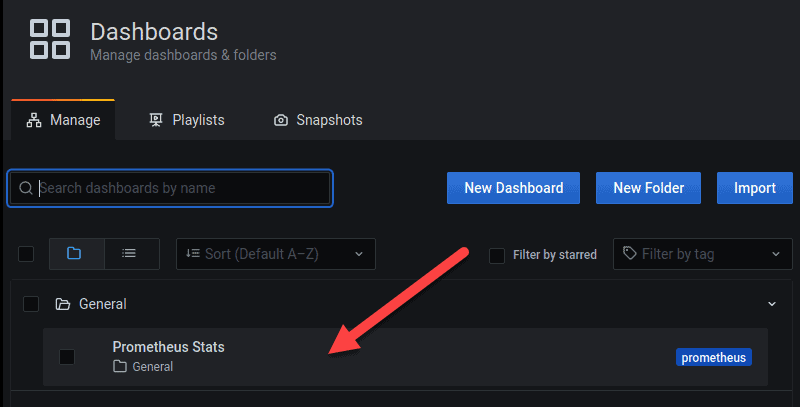
7. Select the Prometheus dashboard you want to manage from the list.
Statistics from Your Prometheus Server
The Prometheus dashboard consists of several single-stat graphs that are described below.
Single Stat Graphs
After you select the Prometheus Stats dashboard on the Dashboard Management page, the stats appear organized in panels.
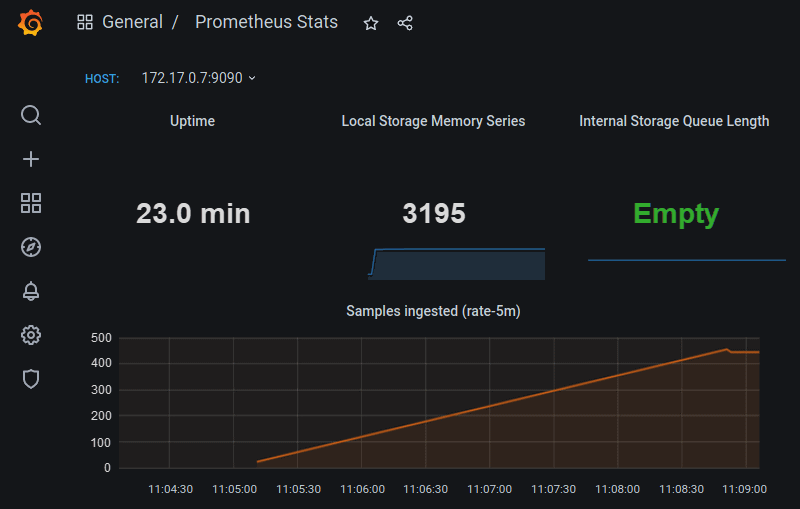
The first row consists of the following panels:
- Uptime: How much time has passed since the Prometheus server was started
- Local Storage Memory Series: The number of series Prometheus currently holds in memory
- Internal Storage Queue Length: The lower this number is the better. The ‘Empty’ message means the queue number is zero.
The Samples ingested panel provides information about the number of sample messages Prometheus ingested at the rate of 5 minutes.
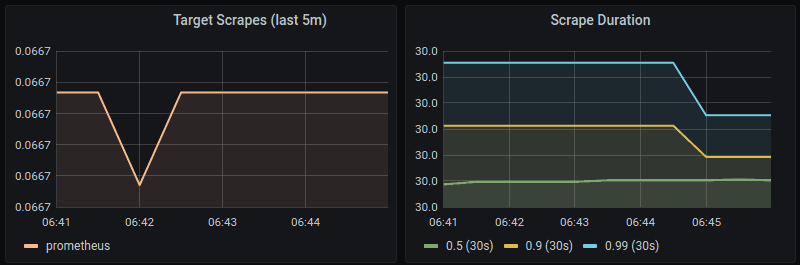
Prometheus Scrape Metrics
Scrape metrics panels are just below the Samples ingested panel.
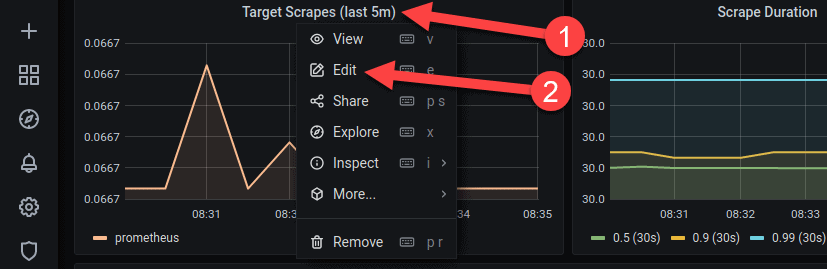
- The Target Scrapes panel shows the frequency of scraping the target, i.e., Prometheus, measured over the last five minutes, per time series in the range vector.
- The Scrape Duration panel shows the duration of scrapes, measured over the same five-minute period.
Evaluations Duration
The Rule Evaluation Duration panel found below the Scrape metrics panels provides information on the length of all evaluations to execute.
Create a New Dashboard
To create a new Grafana dashboard:
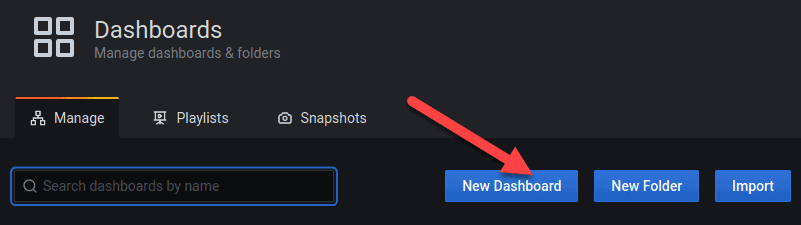
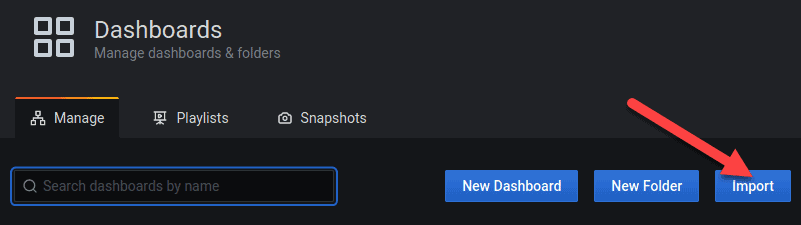
1. Navigate to the Dashboards page and click the New Dashboard button.
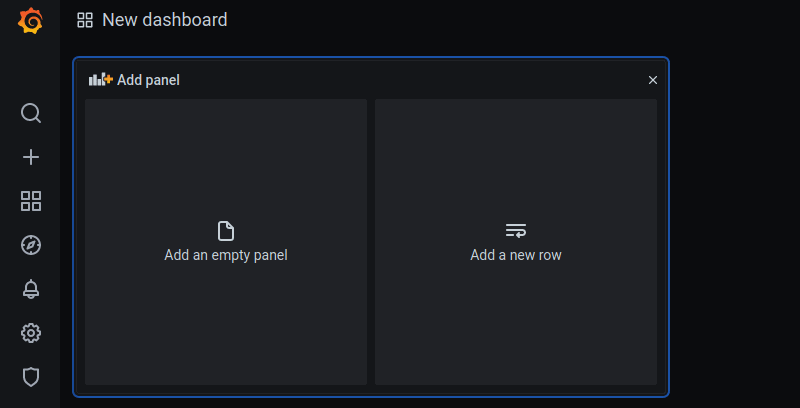
2. A screen appears where you can add new empty panels and rows.
3. A new screen appears with a single dummy panel.
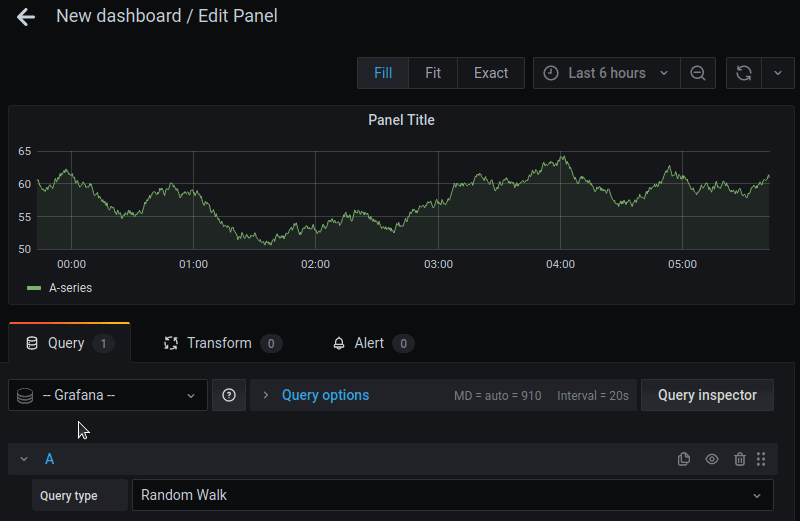
Customize the Dashboard Using Prometheus Query Editor
To edit a specific Grafana panel:
1. Click the panel’s title to open a drop-down menu.
2. In the menu, click Edit.
3. The edit window appears. Customize panels by introducing new queries or modifying the current ones. The querying is performed using Prometheus query language.
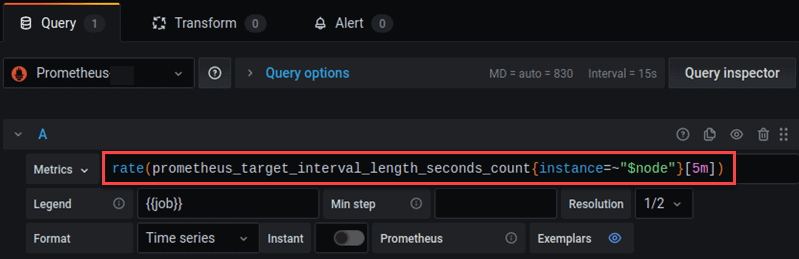
4. The following metrics are not featured in Grafana’s premade Prometheus dashboard, but are useful for monitoring Prometheus:
prometheus_local_storage_memory_chunks– Monitors memory chunks Prometheus stores in memory.prometheus_local_storage_memory_series– Monitors memory series Prometheus stores in memory.prometheus_local_storage_ingested_samples_total– Measures the ingestion rate for the samples.prometheus_target_interval_length_seconds– Measures the amount of time between target scrapes.prometheus_local_storage_chunk_ops_total– Monitors the per-second rate of all Prometheus storage chunk operations.
Use Premade Dashboards and Plugins
Grafana offers a large selection of premade dashboards and plugins available for download on its website. To install a premade dashboard:
1. Download the plugin’s json file.
2. Click the Import button and follow the instructions to upload the file to Grafana.
3. To install plugins, log into the Grafana pod in the cluster using kubectl exec.
kubectl exec -it [grafana-pod] -- [shell]
4. Now use the grafana-cli command-line tool to install the plugin:
grafana-cli plugins install grafana-worldmap-panel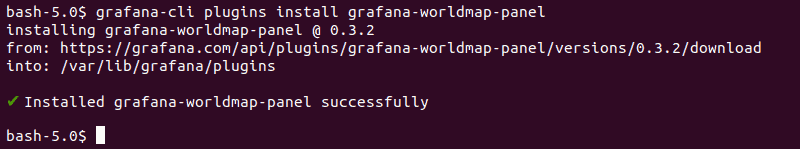
The plugin installs to the Grafana plugins directory. The default location is /var/lib/grafana/plugins. Once the plugin is successfully installed, it is automatically available in Grafana.
Conclusion
After reading this tutorial, you should be able to install and set up Grafana to use it with Prometheus, an important DevOps tool. If you are interested in Prometheus in terms of cloud monitoring, read the guide dedicated to the best cloud monitoring tools.