Prometheus enables performance analysis of software and infrastructure by collecting and storing detailed system metrics in near real-time. It is frequently deployed on Kubernetes to monitor CPU performance, memory usage, network traffic, Kubernetes pod status, etc.
This article explains how to install and set up Prometheus monitoring in a Kubernetes cluster.
Prerequisites
- A Kubernetes cluster.
- Kubectl installed.
What Is Prometheus?
Prometheus is an open-source platform for collecting, storing, and visualizing time-series metrics. It can track response time, error rate, and resource utilization. These features help identify bottlenecks and optimize system performance.
By leveraging the flexibility of the Prometheus Query Language (PromQL), Prometheus allows users to:
- Perform deep analysis of specific metrics by using labels and functions.
- Correlate data from multiple sources.
- Gain insight into the system's performance and behavior.
The horizontal scaling ability and the capacity to handle large volumes of data make Prometheus suitable for monitoring complex and dynamic environments.
Prometheus Features
Prometheus offers robust alerting and monitoring capabilities, making it a frequent choice for DevOps. The major Prometheus features include:
- The highly efficient time-series database designed to handle large volumes of metrics data.
- Flexible query language (PromQL) that simplifies data analysis and visualization.
- Seamless Kubernetes integration that enables Prometheus to discover and monitor nodes, services, and pods automatically.
- A pull-based monitoring system that proactively pulls (rather than pushes) metrics from target endpoints, reducing resource overhead.
- Rich ecosystem with many available integrations and exporters, allowing users to customize the platform according to their needs.
Prometheus Architecture
Prometheus utilizes the server model for time-series data collection, storage, and processing. The following are the essential components of the platform's architecture:
- Prometheus server. The central component of Prometheus, responsible for ingesting metrics, executing queries, and alerting.
- Exporters. Components specialized for collecting and exposing metrics in a format Prometheus can read.
- Pushgateway. An intermediary service for pushing metrics from quick, ephemeral processes, which would not be caught in Prometheus' regular scraping interval.
- Alertmanager. The component handling and routing of server-generated alerts.
How to Install Prometheus on Kubernetes
Prometheus monitoring can be installed on a Kubernetes cluster using a set of YAML files. These files contain configurations, permissions, and services that allow Prometheus to access resources and pull information by scraping the elements of the cluster.
Note: The YAML files below are not meant to be used "as is" in a production environment. Instead, adjust these files to fit the system requirements.
Follow the steps below to install Prometheus in a cluster.
Step 1: Create Monitoring Namespace
All the resources in Kubernetes are launched in a namespace. Unless one is specified, the system uses the default namespace. To better control the cluster monitoring process, specify a monitoring namespace.
Enter the following command to create a monitoring namespace for retrieving metrics from the Kubernetes API:
kubectl create namespace monitoringThe output confirms the namespace creation.

Alternatively, follow the steps below to create the namespace using a YAML file:
1. Create and open a YAML file using a text editor such as Nano:
nano monitoring.yaml2. Copy and paste the following code into the file:
apiVersion: v1
kind: Namespace
metadata:
  name: monitoring
3. Apply the file by typing:
kubectl apply -f monitoring.yamlThis method is convenient as the file can be used for all future instances.
4. List existing namespaces by entering the following:
kubectl get nsThe namespace appears in the list.

Note: Learn how to delete a Kubernetes namespace.
Step 2: Create Persistent Volume and Persistent Volume Claim
A Prometheus deployment requires dedicated storage space to store scraping data. A practical way to fulfill this requirement is to connect the Prometheus deployment to an NFS volume.
The following is a procedure for creating an NFS volume for Prometheus and including it in the deployment via persistent volumes:
1. Install the NFS server on the storage hosting system:
sudo apt install nfs-kernel-server2. Create a directory to use with Prometheus:
sudo mkdir -p /mnt/nfs/promdata3. Change the ownership of the directory:
sudo chown nobody:nogroup /mnt/nfs/promdata4. Change the permissions for the directory:
sudo chmod 777 /mnt/nfs/promdata5. Create a new YAML file:
nano pv-pvc.yaml6. Paste the following configuration into the file:
apiVersion: v1
kind: PersistentVolume
metadata:
  name: pv-nfs-data
  namespace: monitoring
  labels:
    type: nfs
    app: prometheus-deployment
spec:
  storageClassName: managed-nfs
  capacity:
    storage: 1Gi
  accessModes:
    - ReadWriteMany
  nfs:
    server: 192.168.49.1
    path: "/mnt/nfs/promdata"
---
apiVersion: v1
kind: PersistentVolumeClaim
metadata:
  name: pvc-nfs-data
  namespace: monitoring
  labels:
    app: prometheus-deployment
spec:
  storageClassName: managed-nfs
  accessModes:
    - ReadWriteMany
  resources:
    requests:
      storage: 500Mi
Adjust the parameters to fit the system. The spec.nfs.server field should correspond to the IP address of the system on which NFS is installed.
7. Save the file and exit.
8. Apply the configuration with kubectl:
kubectl apply -f pv-pvc.yaml
Step 3: Create Cluster Role, Service Account, and Cluster Role Binding
Namespaces are designed to limit the permissions of default roles. To retrieve cluster-wide data, give Prometheus access to all cluster resources.
The steps below explain how to create and apply a basic set of YAML files that provide Prometheus with cluster-wide access:
1. Create a file for the cluster role definition:
nano cluster-role.yaml2. Copy the following configuration and adjust it according to the specific needs:
apiVersion: rbac.authorization.k8s.io/v1
kind: ClusterRole
metadata:
  name: prometheus
rules:
- apiGroups: [""]
  resources:
  - nodes
  - services
  - endpoints
  - pods
  verbs: ["get", "list", "watch"]
- apiGroups:
  - extensions
  resources:
  - ingresses
  verbs: ["get", "list", "watch"]
The verbs on each rule define the actions the role can take on the apiGroups.
Save the file and exit.
3. Apply the file:
kubectl apply -f cluster-role.yaml4. Create a service account file:
nano service-account.yaml5. Copy the configuration below to define a service account:
apiVersion: v1
kind: ServiceAccount
metadata:
  name: prometheus
  namespace: monitoring
Save the file and exit.
6. Apply the file:
kubectl apply -f service-account.yaml7. Create another file in a text editor:
nano cluster-role-binding.yaml8. Paste the code below to define ClusterRoleBinding. This action binds the Service Account to the previously created Cluster Role.
apiVersion: rbac.authorization.k8s.io/v1
kind: ClusterRoleBinding
metadata:
  name: prometheus
roleRef:
  apiGroup: rbac.authorization.k8s.io
  kind: ClusterRole
  name: prometheus
subjects:
- kind: ServiceAccount
  name: prometheus
  namespace: monitoring
Save the file and exit.
9. Finally, apply the binding with kubectl:
kubectl apply -f cluster-role-binding.yamlPrometheus now has cluster-wide access from the monitoring namespace.
Step 4: Create Prometheus ConfigMap
This section of the file provides instructions for the scraping process. Specific instructions for each element of the Kubernetes cluster should be customized to match individual monitoring requirements and cluster setup.
The example in this article uses a simple ConfigMap that defines the scrape and evaluation intervals, jobs, and targets:
1. Create the file in a text editor:
nano configmap.yaml2. Copy the configuration below:
apiVersion: v1
kind: ConfigMap
metadata:
  name: prometheus-config
  namespace: monitoring
data:
  prometheus.yml: |
    global:
      scrape_interval:     15s
      evaluation_interval: 15s
    alerting:
      alertmanagers:
      - static_configs:
        - targets:
    rule_files:
      # - "example-file.yaml"
    scrape_configs:
      - job_name: 'prometheus'
        static_configs:
        - targets: ['localhost:9090']
3. Save the file and exit.
4. Apply the ConfigMap with kubectl:
kubectl apply -f configmap.yamlWhile the above configuration is sufficient to create a test Prometheus deployment, ConfigMaps usually provide further configuration details. The following sections discuss some additional options that can be included in the file.
Scrape Node
This service discovery exposes the nodes that make up a Kubernetes cluster. The kubelet runs on every node and is a source of valuable information.
Scrape kubelet
     - job_name: 'kubelet'
      kubernetes_sd_configs:
      - role: node
      scheme: https
      tls_config:
        ca_file: /var/run/secrets/kubernetes.io/serviceaccount/ca.crt
        insecure_skip_verify: true  # Required with Minikube.
Scrape cAdvisor (container level information)
The kubelet only provides information about itself and not the containers. Use an exporter to receive information from the container level. The cAdvisor is already embedded and only needs a metrics_path: /metrics/cadvisor for Prometheus to collect container data:
    - job_name: 'cadvisor'
      kubernetes_sd_configs:
      - role: node
      scheme: https
      tls_config:
        ca_file: /var/run/secrets/kubernetes.io/serviceaccount/ca.crt
        insecure_skip_verify: true  # Required with Minikube.
      metrics_path: /metrics/cadvisor
Scrape APIServer
Use the endpoints role to target each application instance. This section of the file allows scraping API servers in a Kubernetes cluster.
    - job_name: 'k8apiserver'
      kubernetes_sd_configs:
      - role: endpoints
      scheme: https
      tls_config:
        ca_file: /var/run/secrets/kubernetes.io/serviceaccount/ca.crt
        insecure_skip_verify: true  # Required if using Minikube.
      bearer_token_file: /var/run/secrets/kubernetes.io/serviceaccount/token
      relabel_configs:
   - source_labels: [__meta_kubernetes_namespace, __meta_kubernetes_service_name, __meta_kubernetes_endpoint_port_name]
        action: keep
        regex: default;kubernetes;https
Scrape Pods for Kubernetes Services (excluding API Servers)
Scrape the pods backing all Kubernetes services and disregard the API server metrics:
- job_name: 'k8services'
      kubernetes_sd_configs:
      - role: endpoints
      relabel_configs:
      - source_labels:
          - __meta_kubernetes_namespace
          - __meta_kubernetes_service_name
        action: drop
        regex: default;kubernetes
      - source_labels:
          - __meta_kubernetes_namespace
        regex: default
        action: keep
      - source_labels: [__meta_kubernetes_service_name]
        target_label: job
Pod Role
Discover all pod ports with the name metrics by using the container name as the job label:
- job_name: 'k8pods'
      kubernetes_sd_configs:
      - role: pod
      relabel_configs:
      - source_labels: [__meta_kubernetes_pod_container_port_name]
        regex: metrics
        action: keep
      - source_labels: [__meta_kubernetes_pod_container_name]
        target_label: job
Step 5: Create Prometheus Deployment File
The deployment .yaml defines the number of replicas and templates to be applied to the defined set of pods. The file also connects the elements defined in the previous files, such as PV and PVC. Follow these steps:
1. Create a file to store the deployment configuration:
nano deployment.yaml2. Copy the following example configuration and adjust it as needed:
apiVersion: apps/v1
kind: Deployment
metadata:
  name: prometheus
  namespace: monitoring
  labels:
    app: prometheus
spec:
  replicas: 1
  strategy:
    rollingUpdate:
      maxSurge: 1
      maxUnavailable: 1
    type: RollingUpdate
  selector:
    matchLabels:
      app: prometheus
  template:
    metadata:
      labels:
        app: prometheus
      annotations:
        prometheus.io/scrape: "true"
        prometheus.io/port: "9090"
    spec:
      containers:
      - name: prometheus
        image: prom/prometheus
        args:
          - '--storage.tsdb.path=/prometheus'
          - '--config.file=/etc/prometheus/prometheus.yml'
        ports:
        - name: web
          containerPort: 9090
        volumeMounts:
        - name: prometheus-config-volume
          mountPath: /etc/prometheus
        - name: prometheus-storage-volume
          mountPath: /prometheus
      restartPolicy: Always

      volumes:
      - name: prometheus-config-volume
        configMap:
            defaultMode: 420
            name: prometheus-config

      - name: prometheus-storage-volume
        persistentVolumeClaim:
            claimName: pvc-nfs-data
3. Save and exit.
4. Deploy Prometheus with the following command:
kubectl apply -f deployment.yamlStep 6: Create Prometheus Service
Prometheus is now running in the cluster. Follow the procedure to create a service and obtain access to the data Prometheus has collected:
1. Create a .yaml to store service-related data:
nano service.yaml2. Define the service in the file:
apiVersion: v1
kind: Service
metadata:
    name: prometheus-service
    namespace: monitoring
    annotations:
        prometheus.io/scrape: 'true'
        prometheus.io/port:   '9090'

spec:
    selector:
        app: prometheus
    type: NodePort
    ports:
    - port: 8080
      targetPort: 9090
      nodePort: 30909
3. Save the file and exit.
4. Create the service with kubectl apply:
kubectl apply -f service.yamlStep 7: Set up kube-state-metrics Monitoring (Optional)
The kube-state-metrics is an exporter that allows Prometheus to scrape the information Kubernetes has about the resources in a cluster. Follow the steps below to set up the kube-state-metrics exporter:
1. Create a YAML file:
nano kube-state-metrics.yaml2. Paste the following code into the file:
---
apiVersion: apps/v1beta2
kind: Deployment
metadata:
  name: kube-state-metrics
spec:
  selector:
    matchLabels:
      app: kube-state-metrics
  replicas: 1
  template:
    metadata:
      labels:
        app: kube-state-metrics
    spec:
      serviceAccountName: prometheus
      containers:
      - name: kube-state-metrics
        image: quay.io/coreos/kube-state-metrics:v1.9.8
        ports:
        - containerPort: 8080
          name: monitoring
---
kind: Service
apiVersion: v1
metadata:
  name: kube-state-metrics
spec:
  selector:
    app: kube-state-metrics
  type: LoadBalancer
  ports:
  - protocol: TCP
    port: 8080
    targetPort: 8080
3. Save the file and exit.
4. Apply the file by entering the following command:
kubectl apply -f kube-state-metrics.yamlHow to Monitor Kubernetes Service with Prometheus
Type the following command to ensure that all the relevant elements run properly in the monitoring namespace:
kubectl get all -n monitoringThe output shows that the pod is running and the deployment is ready.

Use the individual node URL and the nodePort defined in the service.yaml file to access Prometheus from a web browser. For example:
http://192.153.99.106:30909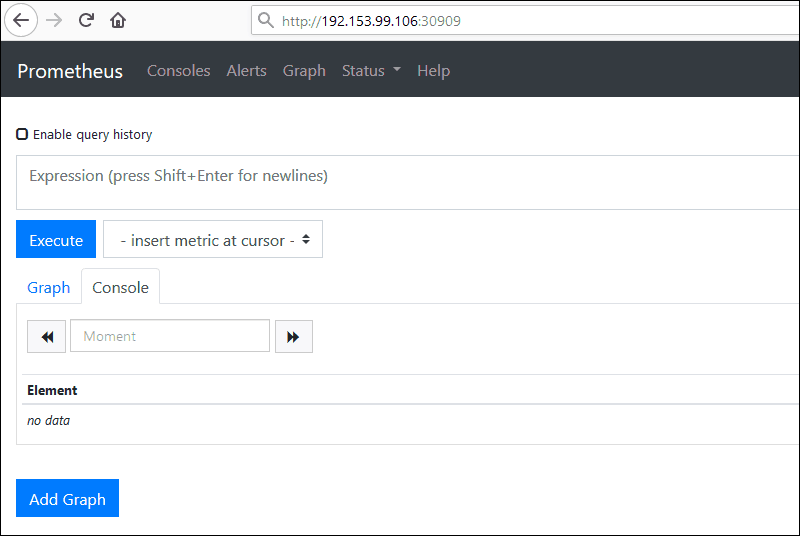
Note: For a comprehensive dashboard system to graph the metrics gathered by Prometheus, try installing Grafana.
How to Monitor Kubernetes Cluster with Prometheus
Prometheus is a pull-based system. It sends an HTTP request, a so-called scrape, based on the configuration defined in the deployment file. The response to this scrape request is stored and parsed along with the metrics for the scrape itself.
The storage is a custom database on the Prometheus server and can handle a massive influx of data. It is possible to monitor thousands of machines simultaneously with a single Prometheus server.
Note: With so much data coming in, disk space can quickly become an issue. To keep extensive long-term records, it is a good idea to provision additional persistent storage volumes.
The data must be appropriately exposed and formatted so Prometheus can collect it. Prometheus can access data directly from the app's client libraries or by using exporters.
Exporters are used for data that the user does not have full control over (for example, kernel metrics). An exporter is a piece of software placed next to the application. Its purpose is to accept HTTP requests from Prometheus, make sure the data is in a supported format, and then provide the requested data to the Prometheus server.
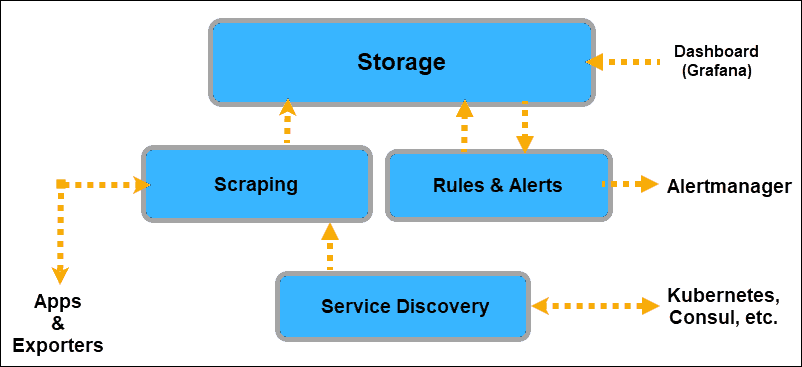
Once the applications are equipped to provide data to Prometheus, Prometheus must be informed where to look for that data. Prometheus discovers targets to scrape from by using Service Discovery.
A Kubernetes cluster already has labels and annotations and an excellent mechanism for keeping track of changes and the status of its elements. Hence, Prometheus uses the Kubernetes API to discover targets.
The Kubernetes service discoveries that the user can expose to Prometheus are:
- node
- endpoint
- service
- pod
- ingress
Prometheus retrieves machine-level metrics separately from the application information. The only way to expose memory, disk space, CPU usage, and bandwidth metrics is to use a node exporter.
Additionally, metrics about cgroups need to be exposed as well. For this purpose, the cAdvisor exporter is already embedded on the Kubernetes node level and can be readily exposed.
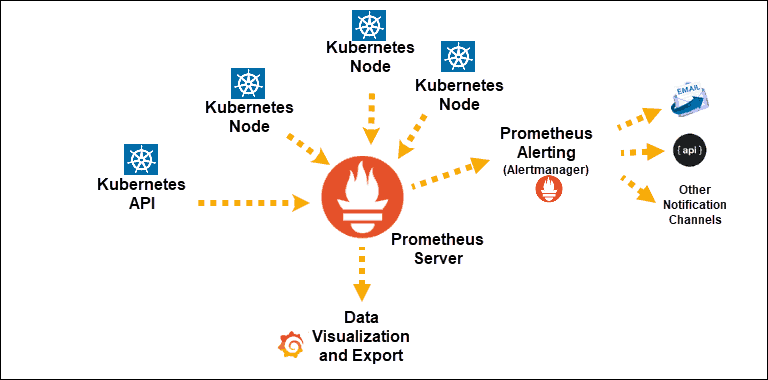
Once the system collects the data, access it by using the PromQL query language, export it to graphical interfaces like Grafana, or use it to send alerts with the Alertmanager.
Conclusion
Now that you have successfully installed Prometheus Monitoring on a Kubernetes cluster, you can track your system's overall health, performance, and behavior.
No matter how large and complex your operations are, a metrics-based monitoring system such as Prometheus is a vital DevOps tool for maintaining a distributed microservices-based architecture.
