Microservices — now the de facto choice for how we build our infrastructure — naturally paved the way for containers. With container orchestration tools like Kubernetes and Docker, organizations can now ship applications more quickly, at greater scale. However, with all that power and automation come challenges, particularly in maintaining visibility into this ephemeral infrastructure.
Monitoring Kubernetes Workloads
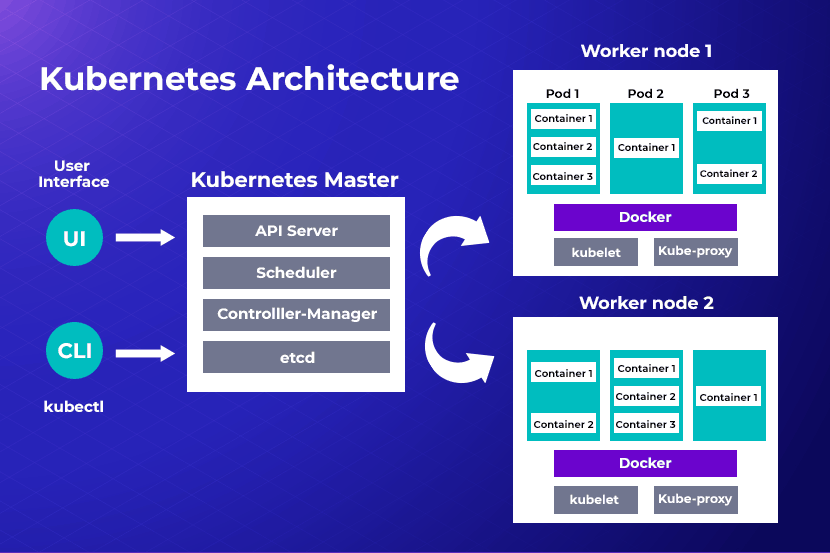
Kubernetes is complex (to find out precisely what Kubernetes is and how it works, read our complete guide on Kubernetes). To use it successfully, several components must be monitored simultaneously. To simplify your monitoring strategy, consider dividing monitoring operations into distinct areas, each corresponding to a specific layer of the Kubernetes environment. Then break down the monitoring of workload from top-down: clusters, pods, applications, and finally, the end-user experience.
Monitoring Kubernetes Clusters
The cluster is the highest-level constituent of Kubernetes. Most Kubernetes installations have just one cluster. This is why monitoring the cluster provides a full view across all areas. And can easily ascertain the health of pods, nodes, and apps that make up the cluster.
When deploying multiple clusters using federation, each cluster must be monitored individually. The areas you will monitor at the cluster level would be:
- Unsuccessful pods: Pods that fail and abort are a regular part of Kubernetes processes. When a pod that should be working at a more efficient level or is inactive, it’s critical to look into the reason behind the anomalies in pod failures.
- Node load: Tracking the load on each node is integral to monitoring efficiency. Some nodes may have a lot more usage than others. Rebalancing the load distribution is key to keeping workloads fluid and effective. This can be done via DaemsonSets.
- Cluster usage: Monitoring cluster infrastructure allows you to adjust the number of nodes in use and dedicate resources to power workloads efficiently. You can see how resources are being distributed, so you can scale up or down and avoid the costs of additional infrastructure. To that end, we recommend learning how to set a container’s memory and CPU usage limit.
Monitoring Kubernetes Pods
Cluster monitoring gives a macro view of the Kubernetes environment, but collecting data from individual pods is also essential. It reveals the health of individual pods and the workloads they are hosting. You get a clearer picture of pod performance at a granular level, beyond the cluster. Here you would monitor:
- Total pod instances: There need to be enough instances of a pod to ensure high availability. This approach ensures that hosting bandwidth is not wasted, and you do not run more pod instances than necessary.
- Pod deployment: Monitoring pod deployments helps identify any misconfigurations that might be reducing pod availability. It’s critical to keep an eye on how resources are distributed to nodes.
- Actual pod instances: Monitoring the number of instances for each pod, comparing actual to expected instances, will reveal how to redistribute resources to achieve the desired pod instance state. ReplicaSets may be misconfigured if you notice varying metrics, making regular analysis crucial.
Monitoring Applications Running in Kubernetes
Applications are not part of Kubernetes, but hosting an application is the whole point of using it. That's why monitoring the application that’s hosted on the cluster is integral for success. Issues revealed by application monitoring could be a problem with the Kubernetes environment or in the application’s code.
By monitoring apps, you can identify and resolve glitches without delay. Start by monitoring:
- Errors: If an error occurs, you can quickly identify and resolve it before it affects end-users.
- Transaction traces help you troubleshoot if apps experience availability or performance issues.
- Application responsiveness: You can monitor how long it takes for an app to respond to a request. You can see if they can handle current workloads or if they are struggling to maintain performance.
- Application availability: Monitor if apps are active, up, and responding efficiently.
Monitoring End-user Experience when Running Kubernetes
End-user experience, such as applications, is technically not part of the Kubernetes platform. The overall goal for an application is to provide end-users with a positive experience, which should be a key part of your Kubernetes monitoring strategy.
Collecting data will let you know how the app is performing, its responsiveness, and its usability. Conducting real-user and synthetic monitoring is crucial for understanding user interactions with Kubernetes workloads. It lets you know if you need to make any adaptations or adjustments, which will enhance usability and improve the frontend.
Monitoring Kubernetes in a Cloud Environment
When Kubernetes is running in the cloud, there are specific factors to consider when planning your monitoring strategy. In the cloud, you will also have to monitor:
- IAM events: You will have to monitor for IAM activity. That includes permissions changes and logins, which are best practices for security in a cloud-based installation or environment.
- Cloud APIs: A cloud provider has its own APIs, which your Kubernetes installation uses to request resources, making it necessary to monitor these APIs.
- Costs: Cloud costs can quickly add up. Cost monitoring helps you budget and avoid overspending on cloud-based Kubernetes services.
- Network performance: In a cloud-based installation, the network can become the most significant hindrance to the performance of your applications. If you monitor the cloud network regularly, you can be sure that data is moving as rapidly as needed so that you can avoid network-related problems.
Monitoring Metrics in Kubernetes
To gain higher visibility into a Kubernetes installation outside of performing different types of monitoring for Kubernetes, there are also several metrics that will give you valuable insight into how your apps are running.
Common Metrics
These are metrics collected from Kubernetes’ code (written in Golang). It allows you to understand what’s going on at a cellular level in the platform.
Node Metrics
Metrics from operating systems enabling Kubernetes’ nodes can give you insight into the overall health of individual nodes. You can monitor memory consumption, filesystem activity, CPU load, usage, and network activity.
Kubelet Metrics
To ensure the Control Plane communicates efficiently with each node where a Kubelet runs, regularly monitor the Kubelet agent.
Kube-State-Metrics
You can get an elective Kubernetes add-on, which generates metrics from the Kubernetes API called Kube-State-Metrics.
Controller Manager Metrics
To ensure effective workload orchestration, you can monitor the requests the Controller makes to external APIs. This is critical in cloud-based Kubernetes deployments.
Scheduler Metrics
To identify and prevent delays, monitor latency in the Scheduler. This way, you can ensure Kubernetes is deploying pods smoothly and on time.
Etcd Metrics
Etcd stores all the configuration data for Kubernetes. Etcd metrics will give you essential visibility into the condition of your cluster.
Container Metrics
Looking specifically into individual containers will allow you to monitor exact resource consumption rather than more general Kubernetes metrics. CAdvisor allows you to analyze resource usage happening inside containers.
API Server Metrics
APIs keep the Kubernetes frontend together, making these metrics vital for gaining visibility into the API Server and, by extension, the entire frontend.
Log Data
Logs are useful to examine when you find a problem revealed by metrics. They provide you with exact and invaluable information, offering more details than metrics. There are many options for logging into most of Kubernetes’ components. Applications also generate log data.
Kubernetes Monitoring Challenges, Solutions, and Tips
Migrating applications from monolithic infrastructures to microservices managed by Kubernetes is a long and intensive process. It can be full of pitfalls and prone to errors. But to achieve higher availability, innovation, cost benefits, scalability, and agility, it’s the only way to grow your business, especially in the cloud. Visibility is the main issue in Kubernetes environments, as real-time interactions of each microservice are challenging due to the platform's complexity. Monitoring is a specialized skill that each enterprise will need to practice and improve upon to be successful.
A Kubernetes cluster can be considered complex due to its multiple servers and integrated private and public cloud services. When an issue arises, numerous logs, data, and other factors need to be examined. Legacy monolithic environments typically require only a few log searches to identify the problem. Kubernetes environments, on the other hand, have one or several logs for the multiple microservices implicated in the issue you’re experiencing.
To address these challenges, we’ve put together the following recommendations for effectively monitoring containerized infrastructure.
Effective Use of the Sidecar Pattern for Improved Application Monitoring in Kubernetes
One key best practice is leveraging role-based access within Kubernetes to provide end-to-end control by a single team with their monitoring solution, and without having complete control of the cluster. Leveraging a monitoring solution under a team namespace enables operators to easily control monitoring for their microservice-based container applications within their team's scope.
However, they can add additional monitoring support without having to rebuild their application container. A dynamic approach to monitoring enhances observability and provides context, all without needing to pull down containers that start exhibiting issues.
Namespace Observability
By leveraging an open source monitoring event pipeline, such as Sensu Go, operations teams can gain a dedicated team view of containers, improving visibility into their applications and increasing insight into possible anomalies. These types of solutions offer dynamic monitoring changes for ephemeral infrastructure. As a result, operators can help drive collaboration securely by using Kubernetes’ built-in concept for role-based access control.
Kubernetes provides namespace scoping for resources, making it possible to give individual teams complete control of applications under their namespace. Operators can also create containers and pods in a Kubernetes namespace, mapping them directly to code-driven monitoring tools that leverage the same namespace.
For example, you can have an ‘Associated’ namespace in an open source monitoring event pipeline – similar to Kubernetes — so that one team can control containers and monitoring around it using a repository of declarative YAML config files. With RBAC (role-based access control), you can mitigate risk by providing only necessary access to a user, ensuring they don’t have more than is needed.
Codifying monitoring workflows into declarative configuration files allows you to monitor at the speed of automation. It can be shared, treated as code, reviewed, edited, and versioned, allowing for efficient multi-cloud operation. Read more on how to install Prometheus on Kubernetes and how to use it.
Best Practices for Logs in Kubernetes
Application log aggregation for containerized workloads is an essential best practice that can improve software development. Due to the ephemeral nature of containerized workloads, a cluster can generate a large number of log entries.
Logging agents like Fluentd and FluentBit (cross-platform, open-source data collection software projects developed initially at Treasure Data) are typically used as DaemonSets to collect the logs for all pods running on a node, using a privileged volume mount of the log files stored by the container runtime. These are cluster-level tools used to aggregate logs into a data lake, such as Elasticsearch, or send them into a stream processor solution like Kafka. You might want to use functional role-based monitoring to track these additional pieces of log aggregation infrastructure running outside of your Kubernetes cluster.
Use a Kubernetes Monitoring Solution
Visibility is essential for enterprises to identify container issues that impede application performance. You can monitor containerized applications running inside Kubernetes pods more efficiently and scale up or down as needed. This is why a comprehensive Kubernetes monitoring solution is critical, providing end-to-end visibility into every component of your applications. From pods, nodes, containers, infrastructure, the Kubernetes platform, to each microservice and end-user device.
Monitor Kubernetes with APM
Implementing an application performance monitoring solution (APM) provides enterprises with visibility into their applications, enabling them to assess overall performance. It organizes and offers insights into Kubernetes clusters, Docker containers, and containerized applications. You can examine the infrastructure’s fundamental metrics, learn about potential impediments, and make adjustments.
Get instant visibility into memory, CPU, and network utilization, and resource usage statistics when deploying APM-monitored container applications. APM metrics quickly identify common issues such as bandwidth-monopolizing applications or recognizing far-reaching container-level network errors.
Improve Visibility of Your Infrastructure
With these tips and monitoring strategies, operators can make significant strides in gaining greater visibility into their container-based infrastructure. And embrace multi-cloud operation with confidence. Want help getting started? Contact one of our experts today.
Article written in collaboration with Jef Spaleta, Principal Developer Advocate at Sensu.