Kubernetes optimizes container orchestration by automating the deployment, scaling, and management of containerized applications. However, maintaining large clusters remains challenging due to the large volume of logs and performance parameters that need monitoring.
This article introduces the Kubernetes Dashboard, a DevOps tool that simplifies container management by providing a visual overview of cluster resources and applications.
What Is Kubernetes Dashboard?
The Kubernetes Dashboard is a web-based user interface (Web UI) for managing Kubernetes apps and resources. It visually represents a cluster's state and simplifies everyday management tasks like app deployment, workload monitoring, and troubleshooting.
Kubernetes Dashboard Benefits
By replacing the traditional kubectl CLI management method with the visual paradigm, the Kubernetes Dashboard brings the following benefits:
- Real-time resource utilization and performance monitoring. Kubernetes metrics server integration provides real-time CPU and memory utilization data for Kubernetes pods and nodes.
- Simplified deployment and scaling with visual validation. Immediate visual feedback on deployment and scaling operations reduces the risk of errors and supports rapid iteration.
- Role-Based Access Control (RBAC) integration. RBAC allows user access control (limiting users to specific resources and namespaces).
- Centralized log aggregation. The centralized log viewing interface eliminates the need to SSH into individual nodes.
- Increased accessibility. The dashboard makes Kubernetes more accessible by offering a visual alternative to the kubectl CLI.
Kubernetes Dashboard Challenges and Limitations
While the Kubernetes Dashboard offers a new management approach and practical features, it also introduces a set of challenges and limitations:
- The dashboard does not support all the functionalities available via kubectl.
- Misconfigured RBAC can lead to privilege escalation and unauthorized access.
- Keeping the dashboard up to date is an additional maintenance burden.
- The dashboard creates performance overhead, which is especially notable in large-scale environments.
- Some advanced API calls are not implemented (e.g., complex CRDs, API Priority and Fairness, raw API interactions using curl).
- Real-time monitoring and log aggregation increase network traffic and CPU load.
How to Install Kubernetes Dashboard
The Kubernetes Dashboard is available as a preconfigured Helm chart. Follow the steps below to deploy it in a cluster:
Note: If you do not have Helm installed, read How to Install Helm on Ubuntu, Mac, and Windows.
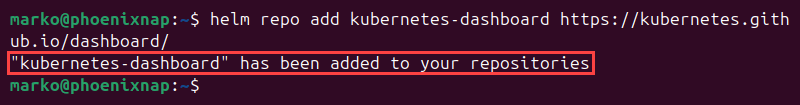
1. Add the Dashboard repository to the local repo list:
helm repo add kubernetes-dashboard https://kubernetes.github.io/dashboard/The output confirms the successful addition.
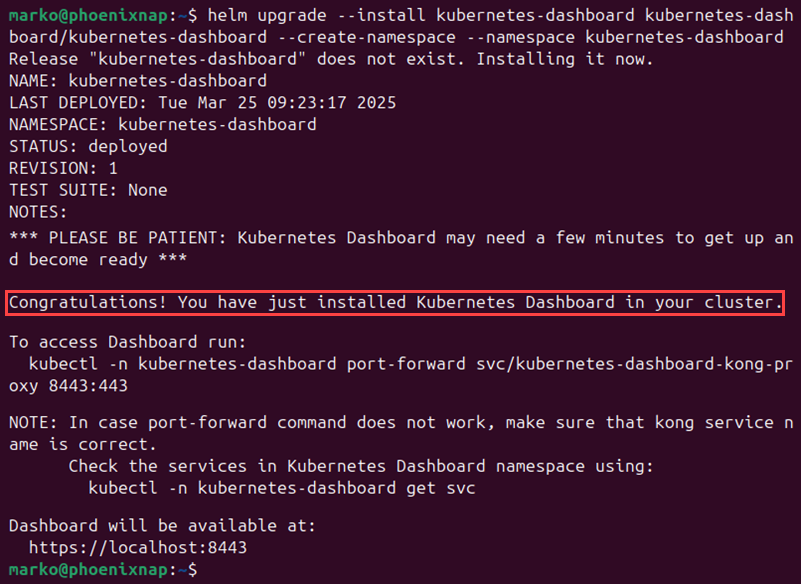
2. Use the helm command below to install the Dashboard:
helm upgrade --install kubernetes-dashboard kubernetes-dashboard/kubernetes-dashboard --create-namespace --namespace kubernetes-dashboardWait for the installation to finish. Once the deployment is complete, an output message appears with confirmation and additional instructions.
How to Use Kubernetes Dashboard
After deploying the Kubernetes Dashboard in the cluster, create a user account to access the application. The following sections explain the post-installation procedure and provide an example of deploying an app using the Kubernetes Dashboard.
Create User
To create a user with sufficient privileges for the Kubernetes Dashboard, create a new service account and grant it administrative privileges via cluster role binding.
Follow the steps below to complete the procedure:
1. Use the following kubectl command to create a service account in the Dashboard's namespace:
kubectl create sa dashboard -n kubernetes-dashboardThe output confirms the service account creation.

2. In a text editor such as Nano, create a new YAML file for the cluster role binding:
nano k8s-dashboard-crb.yaml3. Paste the following code into the text:
apiVersion: rbac.authorization.k8s.io/v1
kind: ClusterRole
metadata:
  name: kubernetes-dashboard-list-namespaces
rules:
- apiGroups: [""]
  resources: ["namespaces"]
  verbs: ["list"]
---
apiVersion: rbac.authorization.k8s.io/v1
kind: ClusterRoleBinding
metadata:
  name: kubernetes-dashboard-list-namespaces
subjects:
- kind: ServiceAccount
  name: dashboard
  namespace: kubernetes-dashboard
roleRef:
  kind: ClusterRole
  name: kubernetes-dashboard-list-namespaces
  apiGroup: rbac.authorization.k8s.io
The code defines a new ClusterRole object that grants the necessary permissions. The role is then bound to a service account named dashboard.
4. Save the file and exit.
5. Apply the changes to the cluster:
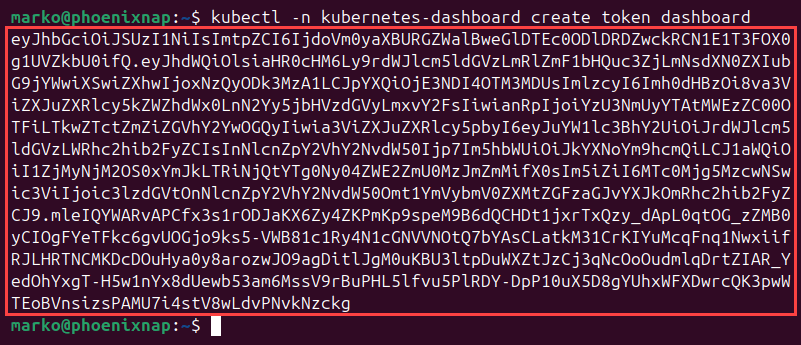
kubectl apply -f k8s-dashboard-crb.yaml6. Use the name of the new account to generate an access token:
kubectl -n kubernetes-dashboard create token dashboard7. Make note of the long alphanumeric string (token) that the command prints in the output.
Access Dashboard
Use the steps below to enable access to the Kubernetes Dashboard:
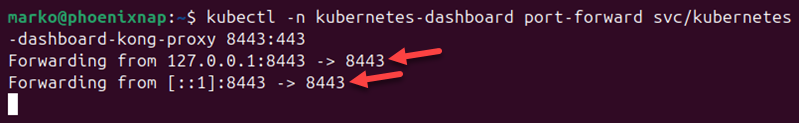
1. Enter the following kubectl port-forward command:
kubectl -n kubernetes-dashboard port-forward svc/kubernetes-dashboard-kong-proxy 8443:443The output shows that kubectl has started forwarding the Dashboard service. Leave the terminal session open.
2. Launch a web browser and navigate to the address below:
https://localhost:84433. If the security warning appears, select Advanced, then press Accept the Risk and Continue.
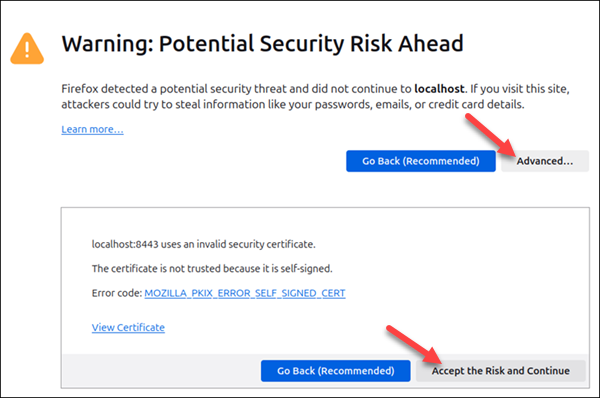
Note: This tutorial uses Firefox. Other browsers may show a different security warning, but the procedure to ignore it is similar.
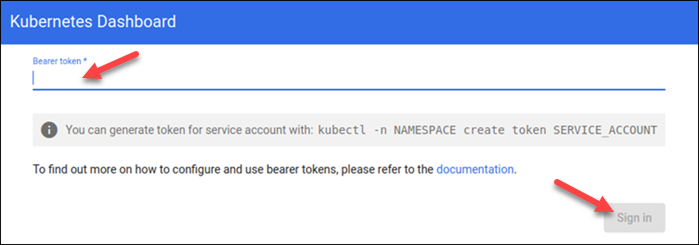
4. Paste the alphanumeric token generated with kubectl into the Bearer token field and click Sign In.
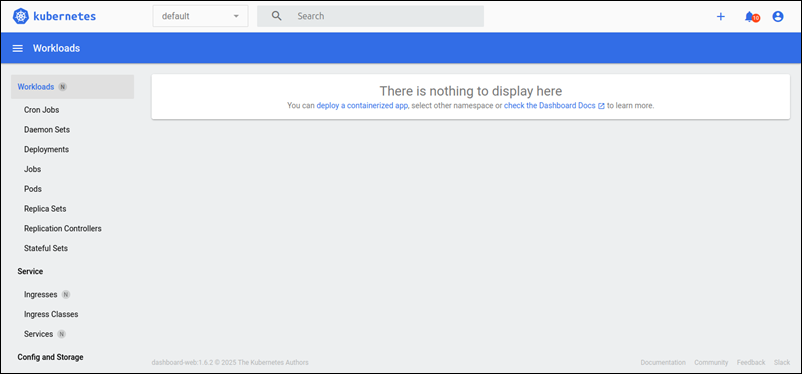
The main Kubernetes Dashboard window appears.
Create Workload
The Kubernetes Dashboard offers multiple ways to create workloads such as Deployments, Daemon Sets, and Jobs.
The following example creates a simple Nginx Deployment:
1. Select the plus sign (+) in the top right corner of the Dashboard window.
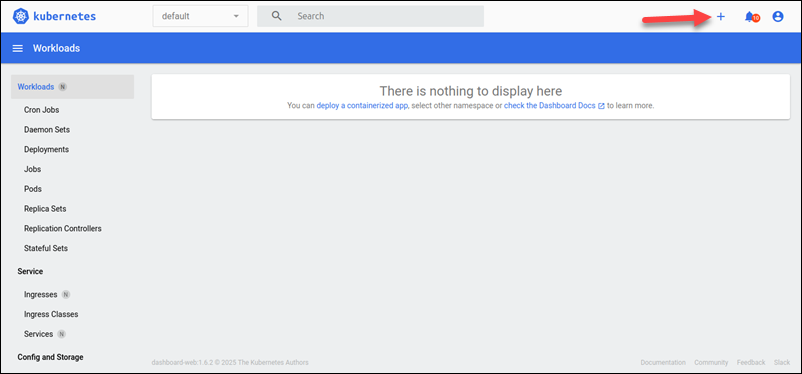
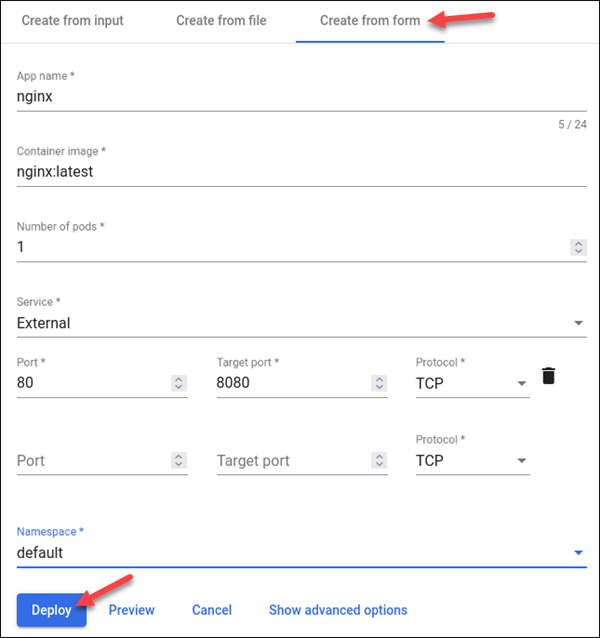
The Create dialog opens, providing three options:
- Create from input. Allows the user to paste and apply the YAML code with one click.
- Create from file. Gives an option to upload a YAML file with a preconfigured workload.
- Create from form. Shows a simple workload creation wizard.
2. Select the workload creation method from the tabs above the dialog window. This example uses Create from form.
3. Fill in the necessary information about the workload, including the App name, Container image, and Number of pods. Set up the service and map the ports.
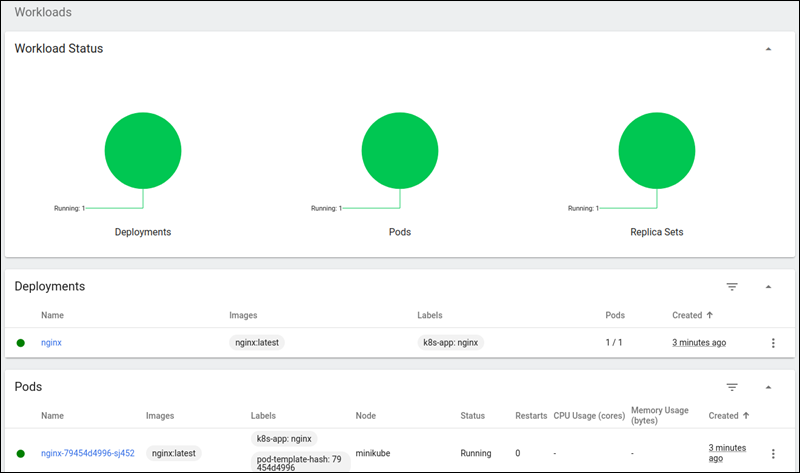
4. When ready, click the Deploy button.
The main window shows the status of the running workloads.
Kubernetes Dashboard Configuration: Best Practices
Optimal setups for the Kubernetes Dashboard prioritize security, controlled access, and ease of maintenance. Read the sections below for more details.
Security
As an additional cluster component, the Kubernetes Dashboard increases the cluster's attack surface. Security measures, including strict RBAC and network policies, are essential to mitigate potential new risks.
When installing the Kubernetes Dashboard, consider the following advice:
- Review and update RBAC rules. Never grant cluster-admin privileges to the Dashboard service account. Create specific roles and role bindings with the least privileges necessary.
- Use namespace isolation. Namespaces can isolate applications and resources. Grant users access only to the namespaces they need.
- Enable secure authentication methods. Avoid using insecure methods like basic authentication, and consider using OAuth 2.0, OpenID Connect, or other secure authentication providers. Authenticate with bearer tokens.
- Create dedicated service accounts. Avoid using the default service account for the Dashboard.
- Use encryption. Encrypt communication between the browser and the Dashboard with HTTPS.
- Restrict network access. Use network policies to allow Dashboard access only to authorized IP addresses and networks.
- Avoid exposing the Dashboard to the public internet. If external access is necessary, use VPNs or reverse proxies with strong authentication.
Maintenance
Regular updates and resource monitoring are essential for ensuring the long-term stability and performance of the Kubernetes Dashboard.
Read the tips below to improve the maintenance of the Dashboard deployment:
- Use the official Helm chart to deploy the Dashboard. This method simplifies installation and updates.
- Keep the Dashboard up-to-date. The newest version ensures benefits from security patches and new features.
- Store Dashboard configurations in version control. Use infrastructure-as-code tools to automate deployments and configurations.
- Set resource limits for the Dashboard pods. This restriction prevents pods from consuming excessive cluster resources.
- Avoid editing within the Dashboard. Apply changes using the
kubectl apply -fcommand and store those files in a git repository to enable version control and auditability.
Troubleshooting with Kubernetes Dashboard
Like any cluster application, Kubernetes Dashboard can encounter issues. This section explores common troubleshooting steps.
Troubleshooting Pod Issues
The Kubernetes Dashboard runs in multiple pods in the kubernetes-dashboard namespace. Use the following commands to check the pods' health:
- Display a list of pods in the Dashboard's namespace and check if any report a status other than Ready:
kubectl get pods -n kubernetes-dashboard- Inspect a specific pod:
kubectl describe pod [pod_name] -n kubernetes-dashboard- Check the pod's logs:
kubectl logs [pod_name] -n kubernetes-dashboardTroubleshooting Services
The following commands help troubleshoot service-related issues:
- Display the list of Kubernetes Dashboard services:
kubectl get service -n kubernetes-dashboard- View more details about a service:
kubectl describe service [service_name] -n kubernetes-dashboard- Print details about all the services at once:
kubectl describe service kubernetes-dashboard -n kubernetes-dashboardTroubleshooting RBAC
To troubleshoot access-related issues, use the following two commands:
- View the list of Kubernetes Dashboard cluster roles:
kubectl get clusterrole -n kubernetes-dashboard- Check the corresponding bindings:
kubectl get clusterrolebinding -n kubernetes-dashboardKubernetes Dashboard Alternatives
While the Kubernetes Dashboard offers features that simplify working with Kubernetes, it may not suit everyone's use case. The following table introduces six popular alternatives:
| Name | Pros | Cons |
|---|---|---|
| Rancher | A complete Kubernetes management platform with multi-cluster management capabilities, a user-friendly GUI, and built-in security and access control. | Steep learning curve, not practical for smaller clusters. |
| Lens | A comprehensive Kubernetes IDE with a user-friendly graphical interface, cluster visualization, and a built-in terminal. | A desktop application (not a web-based dashboard) that consumes more resources. |
| Okteto | A fully automated development environment in Kubernetes. Focus on development workflows, fast iteration cycles, and integration with local development tools. | Less focused on general cluster management. |
| Argo CD | A declarative, GitOps continuous delivery tool for Kubernetes. Automated application deployments and rollbacks. | Focuses on application deployment, not general cluster management. |
| K9s | A simple UI for interacting with Kubernetes clusters. Fast, efficient, and lightweight. | Terminal-based. |
| Kubectl | The official Kubernetes command-line tool. Highly powerful and flexible, providing direct access to the Kubernetes API. Widely used and well-documented. | Lacks a GUI. Steep learning curve. |
Conclusion
This article presented the Kubernetes Dashboard, a GUI tool for managing Kubernetes clusters. It introduced you to the tool's benefits and limitations, provided installation and setup steps, and offered tips for usage and troubleshooting.
Next, check out the best Kubernetes tools or learn more about Kubernetes monitoring best practices.