Linux offers a variety of tools for monitoring network traffic and bandwidth usage. These tools help users maintain a stable network, pinpoint the causes of slowdowns, and quickly fix malfunctions.
Explore the best CLI and GUI network monitoring tools available in Linux.

Prerequisites
- A user account with sudo or root privileges.
- Command-line access.
- EPEL repository enabled (for RHEL and Rocky Linux systems).
How to Check Network Bandwidth Usage in Linux?
You can monitor network bandwidth usage on a Linux system with command-line (CLI) or graphical user interface (GUI) tools.
Command-line network monitoring tools are excellent for Linux servers without a graphical interface. With a few simple commands, users can quickly get an overview of network bandwidth metrics directly in the terminal shell. When used in scripts, these tools automate monitoring tasks, track changes in real-time, and reduce response times.
A GUI tool organizes and presents network data visually, often in graphs and charts. A graphical interface simplifies monitoring network bandwidth and performance, even for users with limited technical experience. Users who run analytics or other tasks that require a detailed representation of network usage over time work more efficiently using a GUI tool.
Command-Line Linux Network Monitoring Tools
This section lists the most used Linux CLI tools for monitoring network traffic and bandwidth.
iftop - Display Bandwidth Usage
iftop provides a real-time display of bandwidth usage for each connection and an overview of the total bandwidth used. The utility is also very useful for checking network speed.
iftop does not store historical data or track traffic by process ID (PID), which may be a significant drawback for many users. To install iftop, use the relevant command for your distribution:
| Linux Distribution | iftop Installation Command |
|---|---|
| Debian/Ubuntu | sudo apt install iftop |
| RHEL/Rocky Linux | sudo yum install epel-release -ysudo yum install iftop -y |
| Fedora | sudo dnf install iftop -y |
| Arch Linux | sudo pacman -S iftop |
| OpenSUSE | sudo zypper install iftop |
To launch iftop, enter the following command:
sudo iftop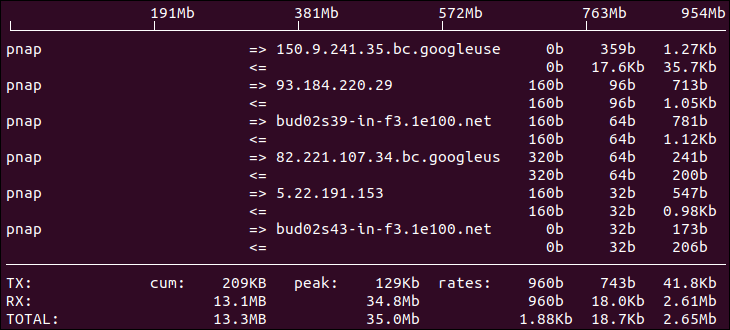
Press q to exit iftop and return to the command prompt.
nload - Displays Network Usage
nload is a command-line utility that reports inbound and outbound traffic. The output includes a real-time graph that provides a quick overview of network activity.
However, nload does not display traffic by PID or socket, nor does it store historical data. Install nload by entering the command for your distribution:
| Linux Distribution | nload Installation Command |
|---|---|
| Debian/Ubuntu | sudo apt install nload |
| RHEL/Rocky Linux | sudo yum install epel-release -ysudo yum install nload -y |
| Fedora | sudo dnf install nload -y |
| Arch Linux | sudo pacman -S nload |
| OpenSUSE | sudo zypper install nload |
Use the following command to launch nload:
sudo nload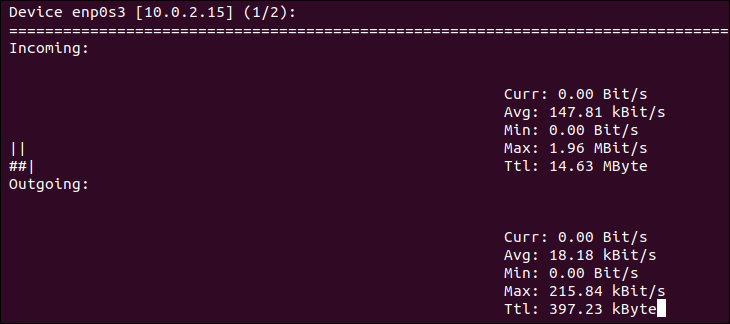
Press q to exit nload and return to the command line.
NetHogs - Monitor Network Traffic Bandwidth
The NetHogs utility tracks network usage per process/application. It allows administrators to diagnose bandwidth spikes and identify which applications are consuming excessive bandwidth. Its key advantage is that it sorts the data by process ID. To install NetHogs, enter:
| Linux Distribution | Nethogs Installation Command |
|---|---|
| Debian/Ubuntu | sudo apt install nethogs |
| RHEL/Rocky Linux | sudo yum install epel-release -ysudo yum install nethogs -y |
| Fedora | sudo dnf install nethogs -y |
| Arch Linux | sudo pacman -S nethogs |
| OpenSUSE | sudo zypper install nethogs |
Once the installation is complete, launch the NetHogs service using:
sudo nethogs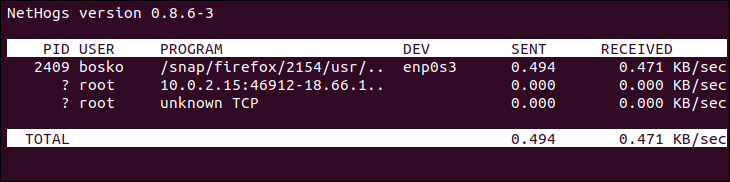
Press q to exit NetHogs and return to the command prompt.
bmon - Bandwidth Monitor and Rate Estimator
bmon monitors bandwidth utilization and provides usage for each device. Users can track bandwidth across multiple network adapters. It captures network statistics and provides a human-friendly graphical output. It does not store historical data but is useful for real-time diagnostics.
To install bmon, enter the command for your distribution:
| Linux Distribution | bmon Installation Command |
|---|---|
| Debian/Ubuntu | sudo apt install bmon -y |
| RHEL/Rocky Linux | sudo yum install epel-release -ysudo yum install bmon -y |
| Fedora | sudo dnf install bmon -y |
| Arch Linux | sudo pacman -S bmon |
| OpenSUSE | sudo zypper install bmon |
To launch bmon, enter:
sudo bmon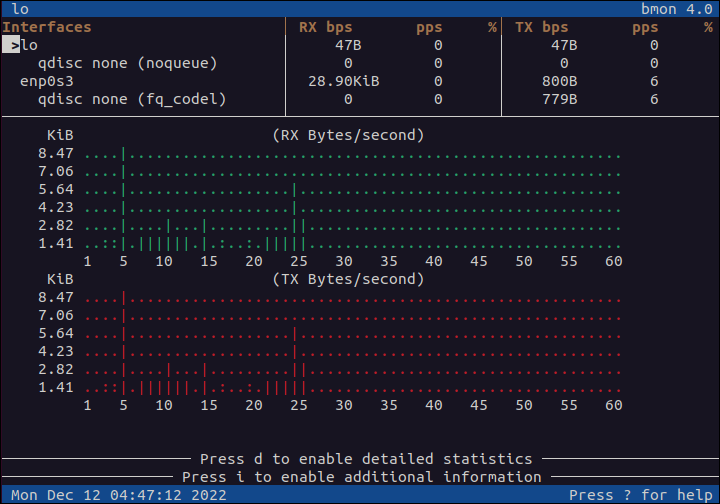
Press q to exit the bmon graph.
vnStat - Network Traffic Monitor
vnStat runs a background daemon to capture bandwidth data. It reads data from the kernel to keep resource usage low. Persistent records are vnStat's key feature - as the daemon runs, it collects and stores bandwidth usage logs.
The vnstat command can be used to display usage statistics and is best suited for statistical reporting.
To install vnStat, enter the command for your distribution:
| Linux Distribution | vnstat Installation Command |
|---|---|
| Debian/Ubuntu | sudo apt install vnstat |
| RHEL/Rocky Linux | sudo yum install epel-release -ysudo yum install vnstat -y |
| Fedora | sudo dnf install vnstat -y |
| Arch Linux | sudo pacman -S vnstat |
| OpenSUSE | sudo zypper install vnstat |
The tool can run in real-time by specifying the -l option:
vnstat -l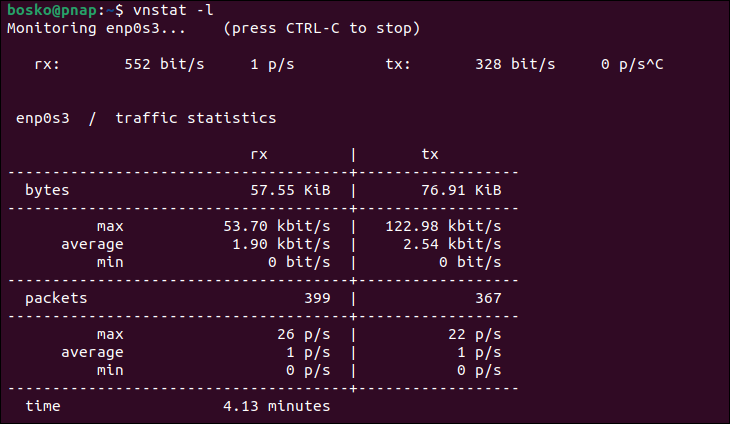
Press Ctrl+C to stop real-time monitoring.
bwm-ng - Bandwidth Monitor Next Generation
bwm-ng is a lightweight, curses-based bandwidth monitor. It provides real-time statistics for network interfaces, displaying bandwidth usage in a simple format. To install bwm-ng, enter the command for your distribution:
| Linux Distribution | bwm-ng Installation Command |
|---|---|
| Debian/Ubuntu | sudo apt install bwm-ng |
| RHEL/Rocky Linux | sudo yum install epel-release -ysudo yum install bwm-ng -y |
| Fedora | sudo dnf install bwm-ng -y |
| Arch Linux | sudo pacman -S bwm-ng |
| OpenSUSE | sudo zypper install bwm-ng |
Use the following command to monitor real-time bandwidth usage across all interfaces:
bwm-ng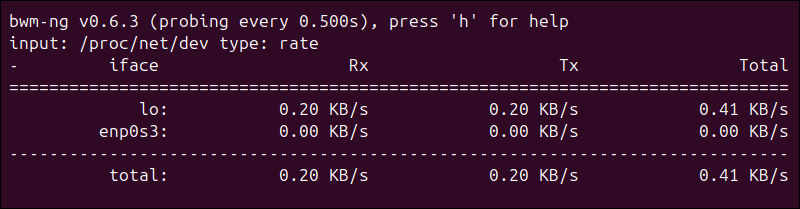
Press q to exit bwm-ng and return to the terminal.
iPerf/iPerf3 - Network Bandwidth Measurement Tool
iPerf monitors network bandwidth by protocol (TCP, UDP, and SCTP) and is best for tuning and maximizing network performance for a particular protocol. iPerf requires a server and a client for testing, which rules it out if you only need to measure network speeds.
To install iPerf3, enter the command for your distribution:
| Linux Distribution | iPerf3 Installation Command |
|---|---|
| Debian/Ubuntu | sudo apt install iperf3 -y |
| RHEL/Rocky Linux | sudo yum install epel-release -ysudo yum install iperf3 -y |
| Fedora | sudo dnf install iperf3 -y |
| Arch Linux | sudo pacman -S iperf3 |
| OpenSUSE | sudo zypper install iperf3 |
Use the -s option to launch iPerf3 in server mode and listen for connections:
iperf3 -s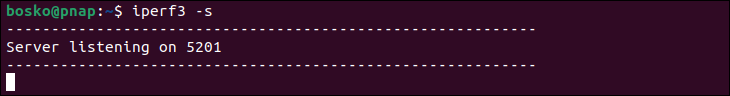
Press Ctrl+C to terminate the server connection.
ss - Socket Statistics
The ss command is part of the iproute2 package and is pre-installed on most Linux distributions. It replaces the older netstat command and provides detailed statistics on network connections, open sockets, and listening ports. ss does not focus on bandwidth monitoring as much as the other tools on the list. However, it is essential for socket-level network diagnostics.
Enter the following command to view network connection statistics:
ss -s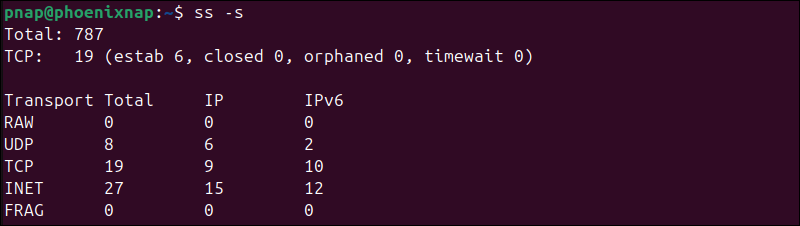
To show all active TCP connections, type:
ss -t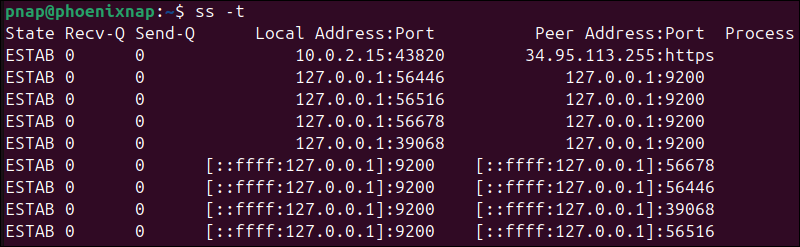
Netperf - Network Bandwidth Testing
Netperf helps monitor network bandwidth using Unix domain sockets, TCP, SCTP, DLPI, and UDP via BSD Sockets. Like iPerf, Netperf also requires a server and a client for testing. Among key features are the numerous predefined tests for measuring performance or data transfer speeds.
Use the corresponding command for your distribution to install Netperf:
| Linux Distribution | Netperf Installation Command |
|---|---|
| Debian/Ubuntu | sudo apt install netperf |
| RHEL/Rocky Linux | sudo yum install epel-release -ysudo yum install netperf -y |
| Fedora | sudo dnf install netperf -y |
| Arch Linux | sudo pacman -S netperf |
| OpenSUSE | sudo zypper install netperf |
Use the following command to launch the service:
netperf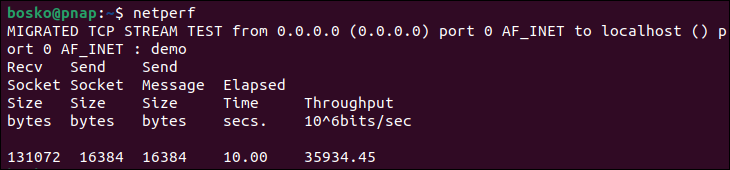
Netperf runs for a predefined amount of time and then terminates automatically.
cbm - Color Bandwidth Meter
The Color Bandwidth Meter (cbm) is a small command-line utility that displays current network traffic on all devices connected to the network. The curses-based output is displayed in colors and shows each network interface, bytes received, sent, and total bytes.
Install cbm on your distribution using the corresponding command:
| Linux Distribution | Netperf Installation Command |
|---|---|
| Debian/Ubuntu | sudo apt install cbm |
| RHEL/Rocky Linux | sudo yum install epel-release -ysudo yum install cbm -y |
| Fedora | sudo dnf install cbm -y |
| Arch Linux | sudo pacman -S cbm |
| OpenSUSE | sudo zypper install cbm |
To start monitoring with cbm, enter:
cbm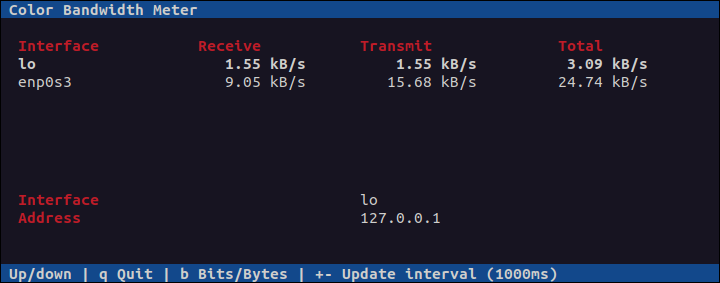
Press q to close the window.
Linux Network Monitoring GUI Tools
The following section highlights popular GUI-based network monitoring tools for Linux. They offer a more comprehensive monitoring suite and interactive control features compared to CLI tools.
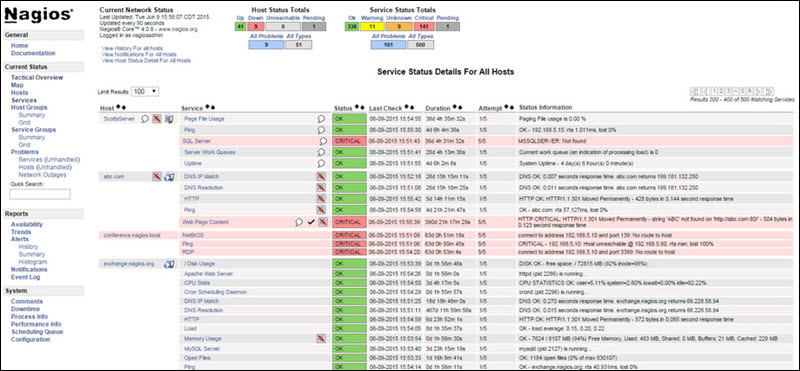
Nagios Core - Monitors Systems, Networks and Infrastructure
Nagios Core is an open-source, feature-rich, free bandwidth monitoring app that also offers a paid version. The tool's web-based interface can monitor multiple services, including HTTP, POP3, and SMTP.
Another great feature is automatic alerts for issues, allowing users to resolve them as soon as they arise. Nagios also provides bandwidth monitoring via SNMP on network devices, such as switches and routers, which helps identify potential bandwidth hogs.
Additionally, Nagios helps monitor bandwidth utilization per port and quickly detects network outages and protocol failures.
Note: Learn the differences between IMAP, POP3 and SMTP.
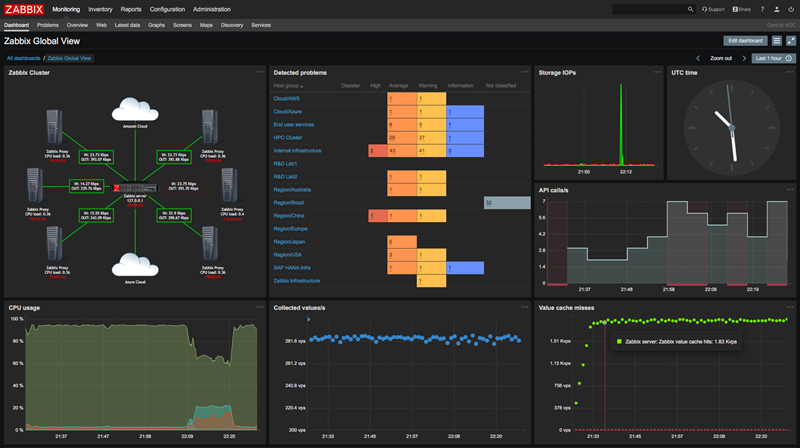
Zabbix - Application and Network Monitoring Tool
Zabbix is a free, open-source, feature-rich network monitoring application designed in a server-client model. Its web-based interface provides real-time monitoring of networks, servers, devices, and apps.
The data logs it generates visually represent network performance or device load metrics and can be used to track and improve network performance. The app is excellent for both small and large commercial apps.
Zabbix supports most standard network protocols, such as HTTP, FTP, SMTP, IMAP, and others, without installing additional software on the monitored devices.
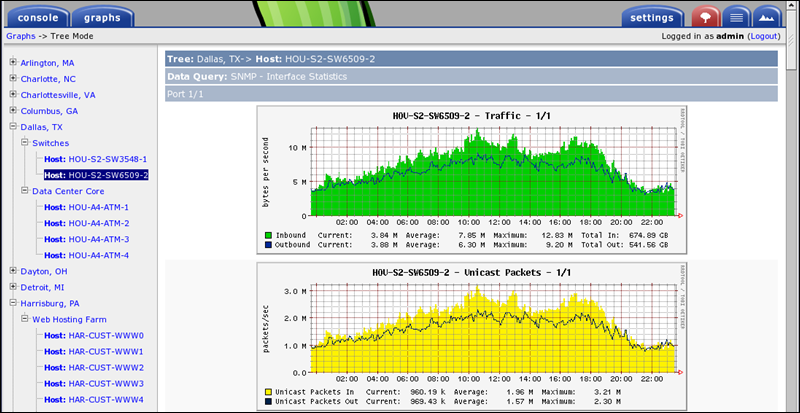
Cacti - Network Monitoring and Graphing Tool
Cacti is a web-based network monitoring tool written in PHP. It features an intuitive and user-friendly interface. Its key advantage is comprehensive data collection and reports on network bandwidth and other metrics, such as user access and permissions.
Cacti collects data using scripts and generates clear charts and graphs, enabling users to quickly pinpoint bandwidth usage spikes or network issues. All data is stored in MySQL databases and used to produce custom graphs.
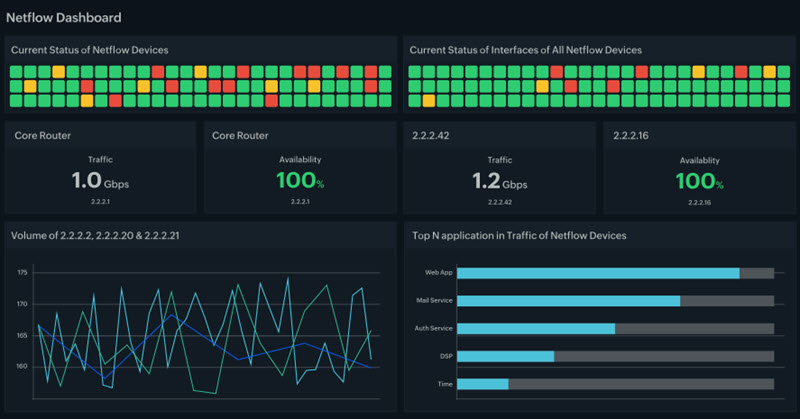
Site 24x7 - NetFlow Analyzer
Site 24x7's NetFlow Analyzer is a cloud-based network monitoring utility that provides a wide range of capabilities across multiple devices. It supports various technologies, such as NetFlow, sFlow, and J-Flow, enabling users to collect statistics for different apps and devices.
The tool can monitor source and destination devices, their interfaces, and traffic flow. Users can configure threshold values for all monitored metrics and receive alerts when thresholds are exceeded.
NetFlow is not free, but it offers a fully functional 30-day trial.
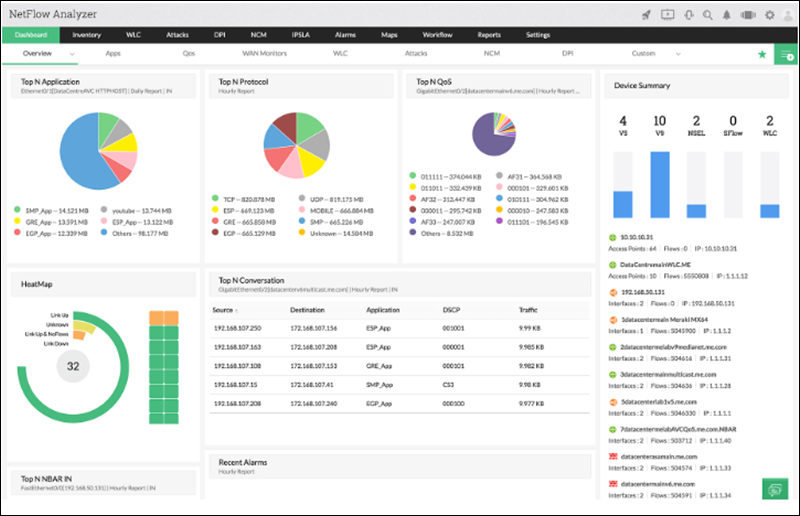
ManageEngine - NetFlow Analyzer
ManageEngine's NetFlow Analyzer is a flow-based network monitoring tool that provides traffic pattern analytics and bandwidth spike detection. By analyzing traffic patterns, users can pinpoint network issues and obtain device, interface, or app details.
The Analyzer provides real-time monitoring and troubleshooting, facilitating the discovery of network issues as soon as they occur. The utility also offers customizable reports that can be accessed with a few clicks. The supported flow technologies are NetFlow, sFlow, IPFIX, Netstream, J-Flow, and AppFlow.
Regarding pricing, the app comes in two flavors: Professional and Enterprise. The main differences are the number of flows per second and the number of supported networks. Both versions also have a free 30-day trial. The Free version is limited to monitoring up to two interfaces.
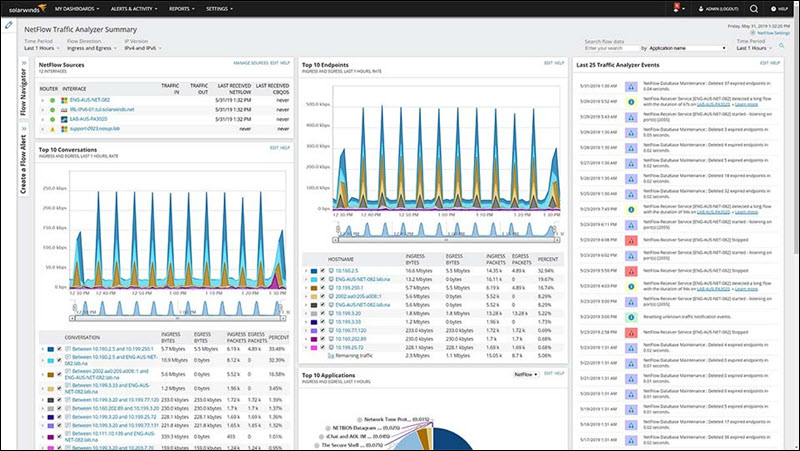
SolarWinds - NetFlow Traffic Analyzer
The NetFlow Traffic Analyzer by SolarWinds is a network monitoring utility that offers a wide range of monitoring capabilities and supports a scalable number of network nodes. The utility offers interactive, visualized data displays with color-coded, searchable data, making it intuitive and user-friendly.
In addition to network monitoring, NTA allows users to monitor bandwidth and receive alerts when traffic issues arise or a device malfunctions. One of its key features is monitoring port 0 for unusual traffic, preventing attacks, and securing the network.
The app comes with a fully functional 30-day free trial, after which users can choose between two license types: Subscription, starting at €875, or Perpetual, starting at €1585.
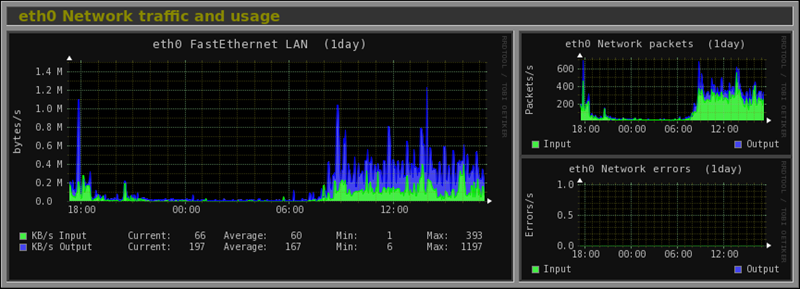
Monitorix - System and Network Monitoring Tool
Monitorix is a free, open-source Linux/Unix server monitoring tool for monitoring system resources and networks. In addition to servers, it supports embedded devices.
It supports IPv4 and IPv6 and allows users to monitor network traffic and bandwidth from all the devices on their network. The lightweight utility includes a built-in HTTP server for viewing the statistics and graphs. The graphs are color-coded for more straightforward analysis.
Aside from network stats, Monitorix can also monitor practically all system resources, including disk drive temperature, system load, kernel usage, CPU usage, ambient sensor stats, and much more.
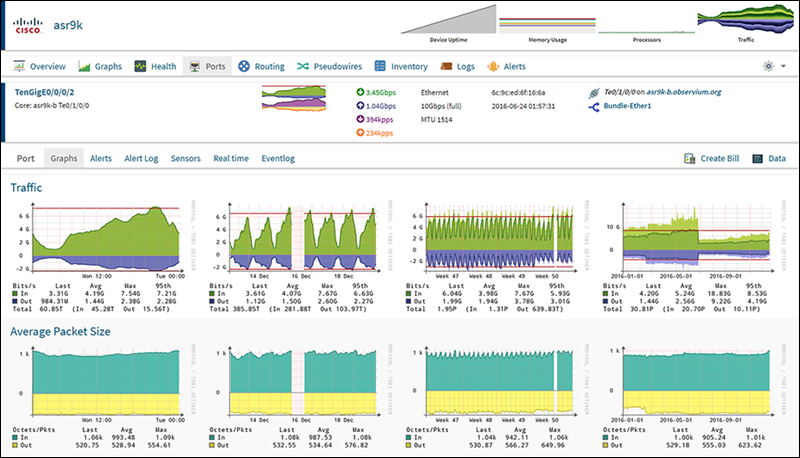
Observium – Network Monitoring Platform
Observium is a network monitoring tool that supports Linux, Windows, FreeBSD, Cisco, and many other platforms and operating systems. It comes with a fully featured and intuitive interface and device autodetection. The app is primarily used with small servers.
It uses standard SNMP network monitoring to collect network metrics, then creates intuitive graphs for effortless, at-a-glance network monitoring.
It comes in two flavors: Observium Community, completely free, and Observium Professional, which receives more frequent updates and new features.
The Community version is recommended for personal servers, while the Professional version offers real-time updates, network activity notifications, and alerts.
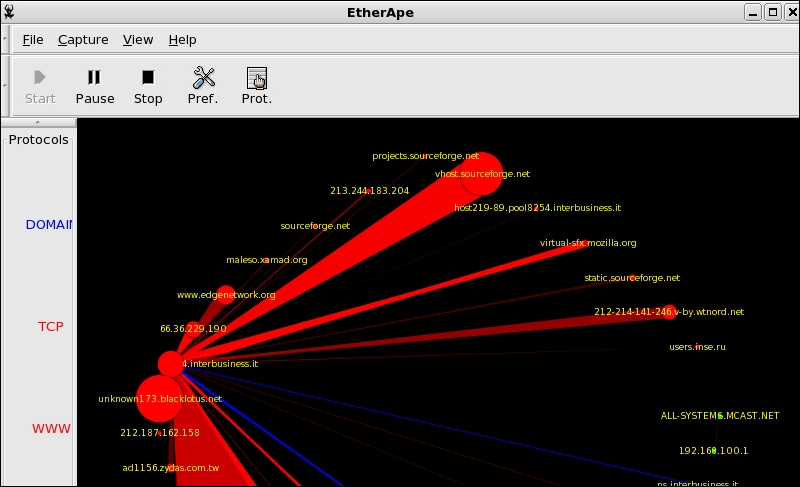
EtherApe - Network Monitoring
EtherApe is a graphical network monitoring tool designed for Linux/Unix. It supports a wide variety of devices, including Ethernet, FDDI, Token Ring, ISDN, PPP, SLIP, and WLAN devices, as well as several encapsulation formats.
The utility can act as a packet sniffer and bandwidth monitoring tool, and display network activity using graphs. It obtains data from a file or from the network in real time, allowing users to filter which traffic they want to see.
Each node in the graph represents a specific host, while the links represent connections to hosts. Everything is color-coded to represent different protocols and various types of network traffic.
EtherApe is completely free and open source.
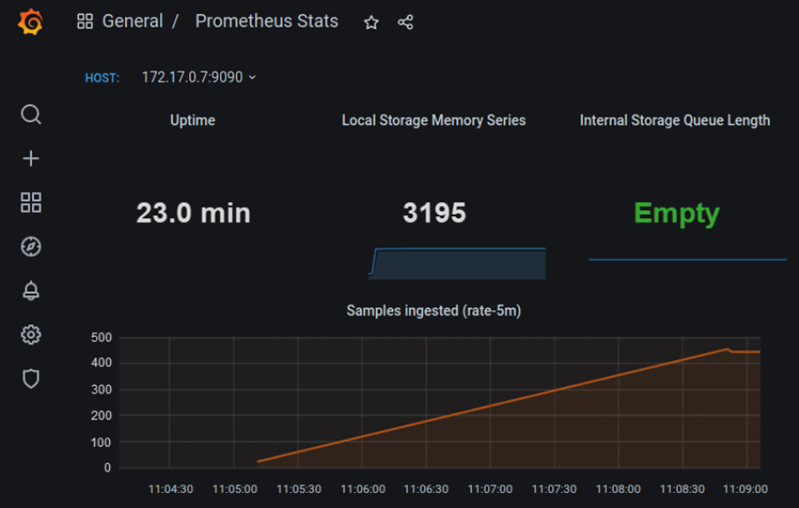
Prometheus with Grafana - Advanced Monitoring and Visualization Stack
Prometheus is an open-source event monitoring software. It is designed to handle a wide variety of network and system metrics, primarily for high-volume, distributed applications. The software has real-time metrics and alerting, an HTTP pull model, and flexible queries.
While Prometheus functions as a standalone application, combining it with a visualization tool like Grafana provides a richer, more interactive experience. Grafana is a popular choice for this scenario because it is open source and supports Prometheus as a default data source. It enables users to create visually engaging, dynamic dashboards to explore data collected by Prometheus.
Prometheus with Grafana is the preferred choice for monitoring Kubernetes clusters.
Note: Learn more in our guide to monitoring Kubernetes clusters with Prometheus.
Why is it Important to Monitor Network Traffic in Linux
Monitoring network bandwidth and performance enables you to:
- Troubleshoot network issues faster. With a network monitoring system and timely alerts, administrators can detect and resolve issues quickly before they escalate.
- Maintain network stability. Admins with a comprehensive overview of network traffic and usage statistics can proactively redeploy resources to ensure optimal performance, even during spikes.
- Identify high bandwidth usage sources. You can quickly identify processes or apps that consume excessive bandwidth and act accordingly by deploying additional resources or optimizing the application.
- Detect unusual activity. Unusual spikes or network activity can be a precursor to a cyber attack or an indicator of system misconfiguration. A monitoring system is essential for preparing and acting preemptively before an issue occurs.
- Manage costs more efficiently. Long-term analytics can provide insight into resource consumption and reveal new opportunities to reduce operating costs (OpEx).
- Balance resource usage. Analyzing network traffic and bandwidth data is essential for enforcing fairer bandwidth usage policies. Administrators can more effectively redistribute resources among users or applications.
Conclusion
This guide explored the top Linux system-monitoring and network bandwidth tools available for both command-line and GUI environments. Test these utilities to assess their capabilities and determine how they align with your business needs.
Next, learn to calculate bandwidth requirements and further optimize your network management strategy.