The tcpdump command is a powerful network packet analyzer used on Linux systems to capture and inspect traffic that passes through network interfaces. It allows administrators, developers, and security professionals to monitor network activity, troubleshoot connectivity issues, and analyze protocols in real time.
This guide will explain what tcpdump is, how to install it on major Linux distributions, its syntax and options, and practical usage examples.
Prerequisites
- A Linux system.
- Access to the command line.
- sudo or root privileges.
How to Install tcpdump
The installation method depends on the package manager used by the Linux distribution. The tool is available in the default repositories of all major systems, but each distribution family uses a different installation command.
The following sections demonstrate how to install tcpdump on Ubuntu, AlmaLinux, and Arch Linux, which represent the Debian-based, Red Hat-based, and Arch-based systems.
Install tcpdump on Ubuntu
Ubuntu and other Debian-based distributions, such as Debian, Linux Mint, and Pop!_OS, use the apt package manager.
The following steps demonstrate the installation on Ubuntu:
1. Update the package index with:
sudo apt update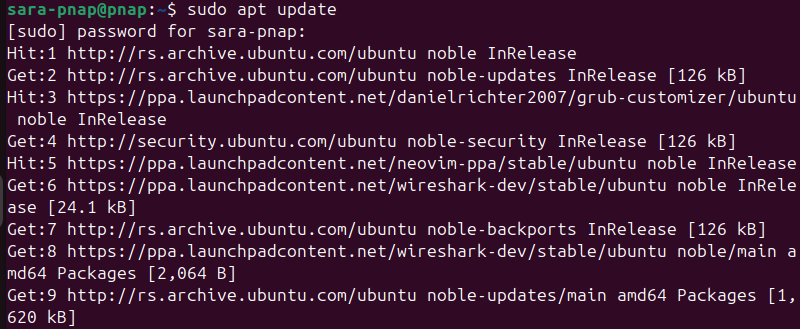
2. Install tcpdump with apt:
sudo apt install tcpdump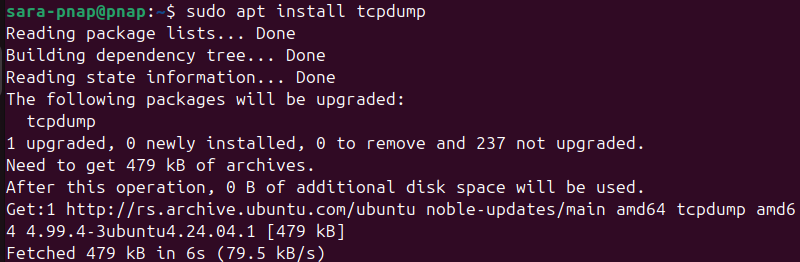
3. Check the tcpdump version to confirm it is on the system:
tcpdump --version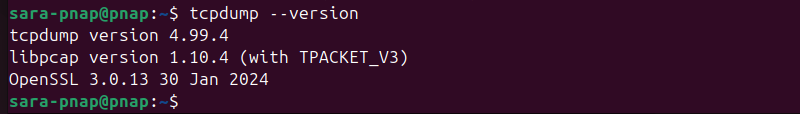
Install tcpdump on AlmaLinux
AlmaLinux and other Red Hat-based distributions, such as Rocky Linux, CentOS Stream, and Red Hat Enterprise Linux (RHEL), use the dnf package manager. The following steps show how to install the tool on AlmaLinux.
1. Update the repository with:
sudo dnf update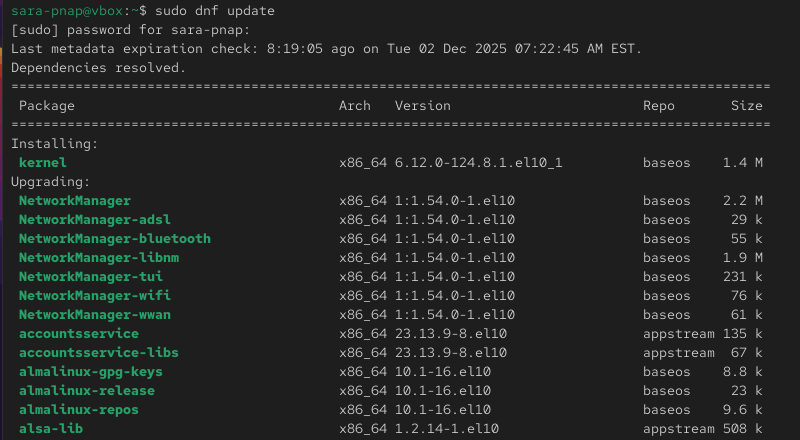
2. Install tcpdump using dnf:
sudo dnf install tcpdump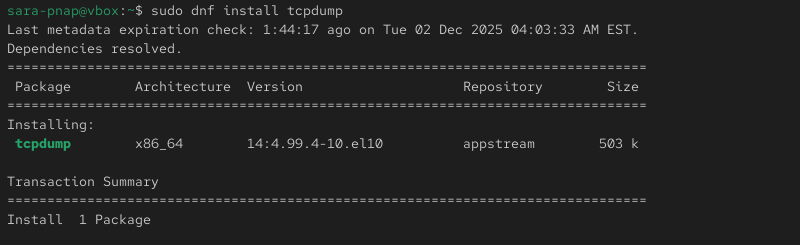
3. Confirm tcpdump is available on the system:
tcpdump --version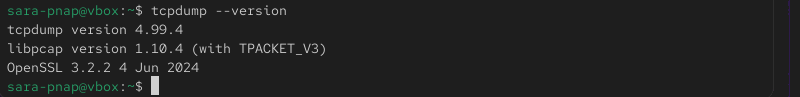
Install tcpdump on Arch Linux
Arch Linux and other Arch-based distributions, like EndeavourOS and Manjaro, use the pacman package manager.
Take these steps to install tcpdump on Arch Linux:
1. Update package information:
sudo pacman -Syu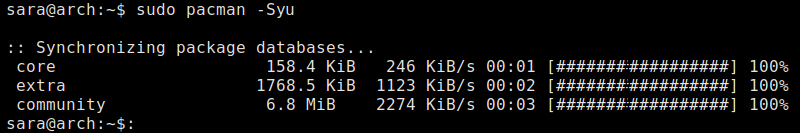
2. Install tcpdump with pacman:
sudo pacman -S tcpdump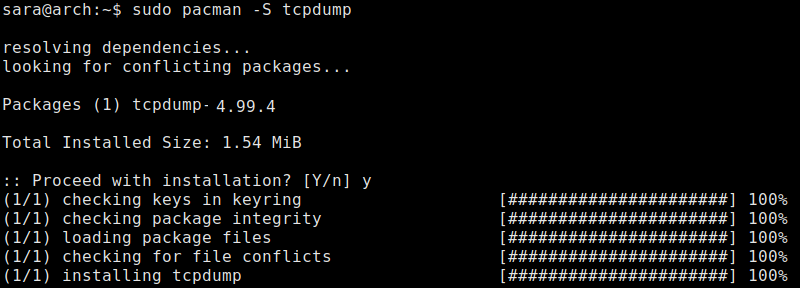
3. Check the version to confirm the installation:
tcpdump --version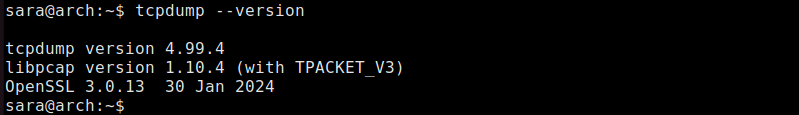
tcpdump Syntax
The basic tcpdump syntax is:
tcpdump [options] [expression]The command consists of:
- Options. Modify how
tcpdumpcaptures and displays packets. - Expression. Defines what traffic to capture, such as protocols, hosts, ports, or network ranges.
The command also works without options or expressions. In that case, it starts to capture all packets on the default network interface, which often produces a large and noisy output.
tcpdump Options
The tcpdump options help modify how the command captures, filters, and displays network traffic. The following table contains the most common options and their purpose:
| Option | Description |
|---|---|
-i | Selects the network interface to capture packets from. |
-nn | Disables hostname and service name resolution, and shows raw IPs and ports. |
-v, -vv, -vvv | Increases output detail and displays more packet fields. |
-c | Captures a specific number of packets and then stops. |
-w | Writes captured packets to a .pcap file (a packet capture file that stores raw network traffic) for later analysis. |
-r | Reads packets from an existing .pcap file instead of live traffic. |
-X | Displays packet data in hexadecimal and ASCII formats. |
-A | Prints packet data in ASCII only. |
-s | Sets the snapshot length to capture full packets or a specified number of bytes. |
-D | Lists all available network interfaces on the system. |
tcpdump Examples
tcpdump is used to inspect live network traffic, isolate communication issues, and record packets for later analysis. The command is flexible and supports both simple and advanced filters, which allows you to capture only the traffic you need.
The following sections show five practical examples that represent the most common real-world use cases.
Capture Packets on a Specific Interface
Use tcpdump to capture traffic on a chosen network interface. This is the most common starting point to examine live network activity.
To accomplish this, use the following syntax:
sudo tcpdump -i [interface-name] -nnThe -i option specifies which interface to listen on, while -nn disables hostname and service name resolution for clearer, numeric output.
For example, to capture packets on enp0s3, replace the [interface-name] parameter with the correct device:
sudo tcpdump -i enp0s3 -nn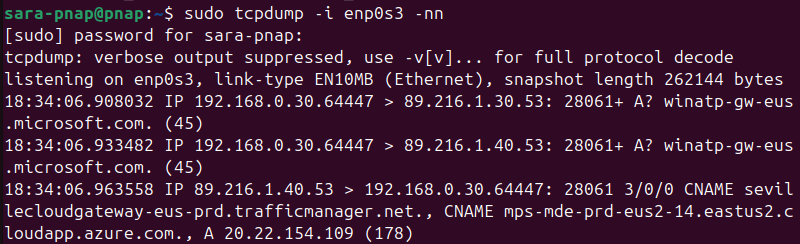
This command listens on enp0s3 and prints each packet as it arrives. The output includes source and destination addresses, ports, and basic protocol information.
If the interface is not handling traffic, tcpdump remains idle until packets are detected, so the terminal sometimes appears empty.
Filter Traffic by Protocol
Use tcpdump to capture only the traffic that matches a specific protocol. The most common method is to use protocol keywords such as tcp, udp, or icmp, which provide clear and readable filters.
To do this, use the following syntax:
tcpdump [protocol] -nnFor example, to capture only TCP traffic on enp0s3, use:
sudo tcpdump -i enp0s3 tcp -nn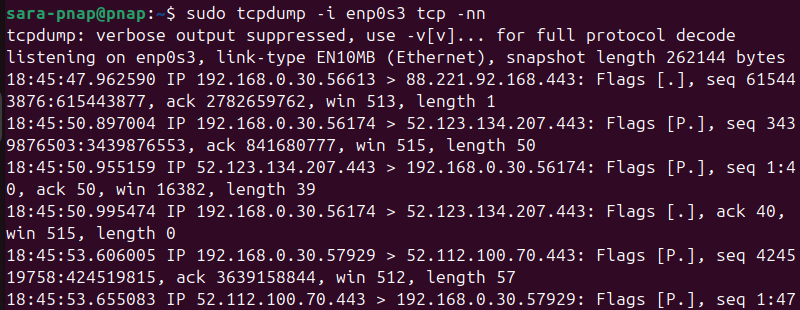
This command listens on enp0s3 and prints only TCP packets. The output displays information such as flags, source and destination ports, and packet lengths.
Capture Traffic on a Specific Port
Limit the output to packets sent to or from a particular port. This is useful when you want to diagnose issues with a known service such as SSH, DNS, or HTTP.
Use the following syntax:
sudo tcpdump port [port-number] -nnThe port filter selects traffic that uses the specified port, and -nn preserves numeric formatting for IPs and ports.
For instance, to inspect HTTPS traffic on port 443, run:
sudo tcpdump -i enp0s3 port 443 -nn
This command captures packets flowing through port 443 on enp0s3. The output highlights connections, packet direction, and TLS session negotiation, which allows you to monitor encrypted web traffic at the packet level.
Capture and Save Traffic to a File
Use tcpdump to record packets for later examination. Save output to a capture file when you need to perform a detailed analysis with tools such as Wireshark.
To do this, use the following syntax:
sudo tcpdump -i [interface-name] -w [file-name].pcapThe -w option writes the raw packet data into a .pcap file, which preserves full packet contents.
For example, to save captured packets from enp0s3 to a file named capture.pcap, use:
sudo tcpdump -i enp0s3 -w capture.pcap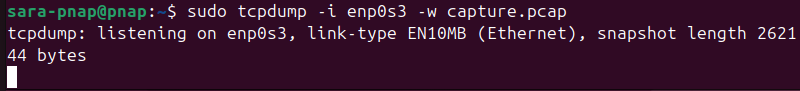
This command records all packets from enp0s3 into capture.pcap, but does not print anything on screen.
The capture continues until you stop it manually with Ctrl+C. Open the file in Wireshark or other packet analysis tools for filtering, inspection, or protocol decoding.
Read Packets From a Saved Capture File
After you save a capture, run tcpdump to read and inspect it directly from the terminal. Use this to review recorded traffic without launching a graphical tool.
To read a saved file, use the following syntax:
sudo tcpdump -r [file-name].pcapThe -r option opens and processes packets stored in the specified .pcap file.
For example, to open capture.pcap, run:
sudo tcpdump -r capture.pcap -nn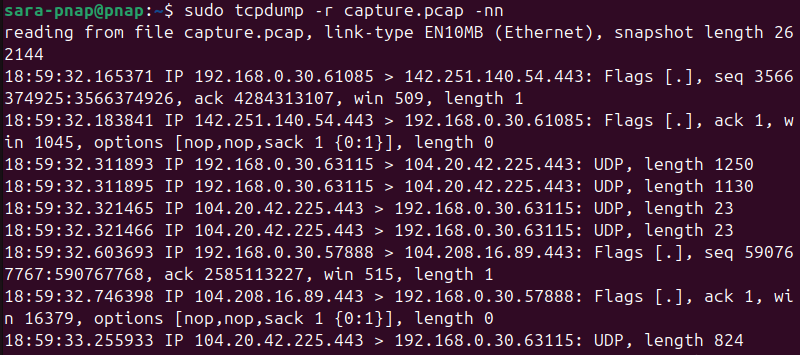
This command prints each recorded packet with numeric addresses and ports. The output allows quick captured data verification or initial triage before you load the file into Wireshark.
Conclusion
This tutorial covered how to install tcpdump on various Linux distributions. It outlined the command syntax and key options. The text also explained their purposes and presented multiple examples to demonstrate practical use cases.
Next, learn about other necessary Linux network commands.