Apache is an open-source web server and an essential element in web development stacks (the A in LAMP and WAMP). Besides serving web pages, it also tracks and keeps records (logs) of server activity and errors.
Apache logs are important for monitoring and troubleshooting web server activity. Knowing how to view, use, and manage Apache log files is essential for server administrators.
This article explores the intricacies of Apache logs, including their locations, types, and how to read their data.

Prerequisites
- A Linux system running Apache web services.
- A user account with sudo/root access.
- Access to the command line/terminal.
What Are Apache Logs?
Apache logs are files that the HTTP server populates with data. The files contain various request and response information, including server activity, errors, and other relevant data.
Apache logs are divided into two main subtypes:
- Access logs. These logs contain all server requests.
- Error logs. These logs register server errors and issues with request processing.
Server administrators, developers, and analysts use these logs to diagnose issues, monitor security, and analyze traffic patterns on a web server. Below is a detailed overview of each subtype.
Apache Access Log
Access logs provide details about who sends requests to the server and what data they request. Each request log contains details, such as the client's IP address, timestamp, the requested URL, HTTP response code, and response body size.
The primary use for these logs is to analyze website traffic, discover potential security threats, and optimize web server performance. Monitoring Apache access logs provides insight into traffic patterns and helps navigate critical decisions regarding server security and optimization.
Example of an Apache Access Log
An example Apache access log entry looks like the following:
127.0.0.1 - - [09/Feb/2024:15:36:14 +0100] "GET / HTTP/1.1" 200 3460 "-" "Mozilla/5.0 (X11; Ubuntu; Linux x86_64; rv:120.0) Gecko/20100101 Firefox/120.0"A single access log entry has detailed information about an HTTP request sent to the Apache server, including the client details, the request, and the server response.
The exact format may vary depending on the Apache log format directives. Every access log entry contains similar elements:
127.0.0.1. The client's IP address. The example entry is the loopback address commonly used for local connections.- -. The placeholder for a remote and authenticated user, if present. The example entry has no specific information, and the dashes are placeholders.[09/Feb/2024:15:36:14 +0100]. The request timestamp with the exact date, time, and timezone."GET / HTTP/1.1". The request method (GET), URL (/), and the HTTP protocol version (HTTP/1.1).200. The HTTP status code the server returned. The example entry shows 200, indicating the request was successful.3460. The response size in bytes. The example value shows the server sent 3460 bytes back to the client."-". The referrer field contains the web page that directs the client to the requested URL. The example value is unavailable."Mozilla/5.0 (X11; Ubuntu; Linux x86_64; rv:120.0) Gecko/20100101 Firefox/120.0". The user-agent string that is sent from the client's web browser. The string contains the browser version (Firefox/120.0) and operating system (Ubuntu Linux).
Default Apache Access Log Location
The default Apache access log location and filename differ across Linux distributions. By default, the Apache file is at one of the following paths:
- /var/log/apache/access.log (Ubuntu and Debian).
- /etc/httpd/logs/access_log (RedHat, CentOS, and Fedora).

The default log location may differ depending on the server configuration.
Apache Error Log
Apache error logs contain critical error reports that the server encounters. The logs capture various error types and details, including SSL/TLS connection data, server status changes, and internal or client errors.
The primary purpose of error logs is to troubleshoot and monitor server problems. These logs are a critical asset when the server encounters errors. Server administrators use these logs to identify and resolve issues quickly and ensure minimal downtime.
Example of an Apache Error Log
An example Apache error log entry looks like the following:
[Fri Feb 09 15:35:24.252107 2024] [core:notice] [pid 6672:tid 139657266624384] AH00094: Command line: '/usr/sbin/apache2'Error log entries contain several distinct sections:
[Fri Feb 09 15:35:24.252107 2024]. The timestamp when the record was added to the error log file. The timestamp format is[Weekday Month Day Hour:Minute:Second.Microsecond Year].[core:notice]. The component that generated the log entry (core) and the severity level (notice).[pid 6672:tid 139657266624384]. The process ID (pid 6672) and thread ID (tid 139657266624384) related to the entry.AH00094: Command line: '/usr/sbin/apache2'. The error log message. The example message shows that Apache is displaying its command-line information.
An error log contains detailed information about events and problems, including timestamps, sources, severities, key identifiers, and error messages. The log information is crucial for identifying and resolving problems quickly.
Default Apache Error Log Location
The default Apache error log locations and file names differ between Linux distributions. The default Apache error log file is at one of the following locations:
- /var/log/apache2/error.log (Ubuntu and Debian).
- /etc/httpd/logs/error_log (RedHat, CentOS, and Fedora).

If the default server configuration differs, the location may also be elsewhere.
How to View Apache Logs
There are several different ways to view Apache logs. Each method offers some advantages and is suitable for a specific use case. The various methods for viewing Apache logs are described in the sections below.
Command-Line Tools
Linux has various command-line tools that simplify viewing and searching through log files. These tools provide a quick, straightforward way to view Apache logs in the terminal. The following three tools are the most common:
- Tail. The tail command displays the last few lines of a log file. Add the
-foption to enable real-time updates in the terminal window. For example:
tail -f /var/log/apache2/error.log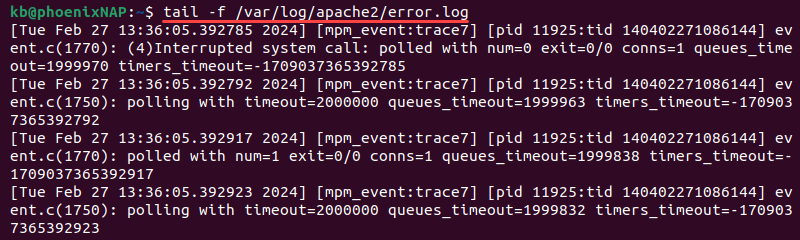
- Less. The less command is a terminal pager that simplifies viewing large files. Additional options allow navigating the file and searching its contents for a specific word or pattern. For example, to view the Apache access log with this command, run:
less /var/log/apache2/access.log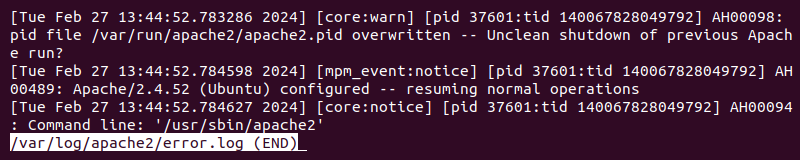
- Grep. The grep command searches for a specified pattern in a file, making it convenient for use in lengthy log files. For example, to view all lines where a 200 appears in an access log file, use:
grep 200 /var/log/apache2/access.log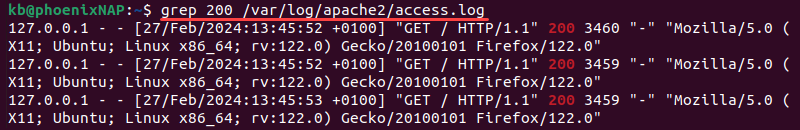
Note: Pipe the grep command with the less or tail commands to get advanced functionalities and monitoring results.
Direct Access
Access the Apache log files directly to view log entries offline and for more complex analysis. Direct access approaches include:
- Text editors. Editors such as nano or Vim are convenient for viewing and manually analyzing log entries. Built-in functionality enables searching and navigating through log files.
- File explorers. A file explorer, such as FileZilla or the operating system file manager, is a GUI method to locate and open Apache log files. This method avoids using the command line.
- Remote access. Protocols such as SSH and SCP provide direct access to Apache log files on a remote server, enabling secure file access and transfer. Alternatively, SFTP can transfer files between a client and server via the Internet.
Log Collectors
Log collectors are solutions designed to improve Apache log management. They provide centralized log data storage and advanced log management features. This includes log management tools, security enhancements, log visualization, and alerting mechanisms.
Popular examples of log collectors are:
- ELK stack. The stack combines Elasticsearch, Logstash, and Kibana to create a powerful, centralized solution for log collection, each with a specific role. Elasticsearch provides scalable storage with search capabilities, Logstash ingests and processes log data, while Kibana offers querying and visualization features.
- Splunk. Splunk is a well-known log analysis and management tool. The platform provides advanced search capabilities, various monitoring options, and custom dashboards.
- Apache Flume. The system collects, aggregates, and moves log data to a centralized storage or for further processing. Apache Flume easily handles multiple sources, making it ideal for distributed large-scale environments.
Configuring Apache Logs
Configuring Apache logs allows you to change the default behavior and format. Customizing Apache log settings enables meeting specific requirements, capturing only the required data, and increasing log management efficiency.
Access the Apache configuration files using a text editor to configure Apache logs. The file location is /etc/apache2/apache2.conf or /etc/httpd/httpd.conf, depending on the OS.
Note: The configuration file on Windows is different and, most likely, in the installation directory. For example: C:\Program Files\Apache Software Foundation\Apache2.4\conf\.
The sections below explain how to configure the main Apache log settings. The example commands use Ubuntu file names and locations, so change the information accordingly if using a different OS.
Changing the Default Apache Log Location
To change the default log location, do the following:
1. Open the Apache configuration file using a text editor. For Vim, run:
sudo vim /etc/apache2/apache2.confEditing the default configuration requires administrator privileges.
2. Locate the ErrorLog directive and change the path. The line looks like the following:
ErrorLog [path]/error.log
Edit the file path or name to the desired
3. To change the access log location, use the CustomLog directive. It consists of at least two arguments: the path with the file name and the log format string. For example:
CustomLog [path]/access.log combined
If not present, add the directive to the config file and choose the file path, name, and log format string.
4. Save the changes and close the editor.
5. Restart the Apache service:
sudo systemctl restart apache2The logs are immediately generated in the new location.
LogLevel Directive
The LogLevel directive controls the severity of the messages logged in the error logs. It contains a single argument, one of the predefined log levels. For example:
LogLevel notice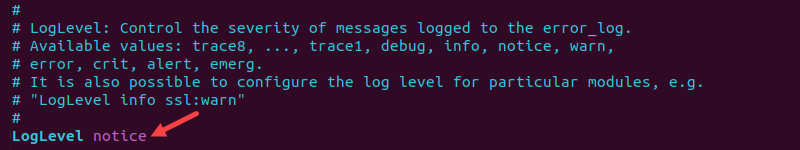
The available levels and their brief description are in the table below:
| Level | Description |
|---|---|
emerg | Emergencies and severe errors. The system is inoperable. |
alert | The system requires immediate action to prevent further damage or interruptions. |
crit | Critical events. The error requires immediate attention but does not result in system failure. |
error | Errors that happen during normal operations. The system does not require immediate attention. |
warn | Potential issues that may require attention. It may lead to errors if unaddressed. |
notice | Normal events. They contain additional information about changes in system behavior. |
info | Informative messages that provide routine server logging activity and events. |
debug | Messages with detailed debugging information. |
trace[1-8] | Trace messages with an increasing detail level. |
When choosing a level, note that it also logs higher-severity events. For example, if the LogLevel directive is crit, the logs also contain alert and emerg messages.
The recommended level for normal operations is at least crit because it includes all alerts that require immediate attention. The debug and trace[1-8] are helpful when troubleshooting since they capture detailed information.
LogFormat Directive
The LogFormat directive allows customizing access log format. A custom format controls which information is in each log entry and shows only the required information in the access log. There are also predefined formats available.
The LogFormat directive syntax has two arguments: the format string and the log format nickname. For example:
LogFormat "[format string]" [nickname]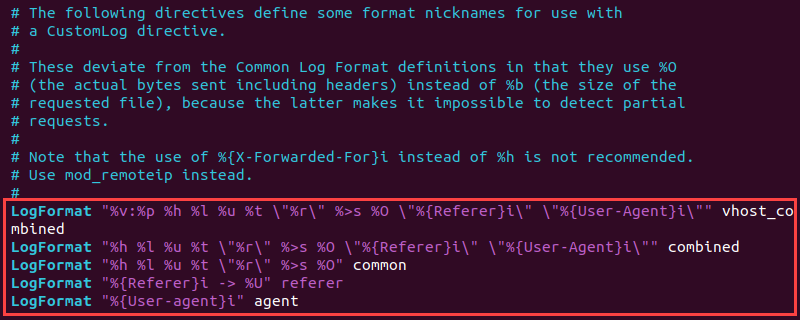
The format string contains placeholders populated with actual entries in the access log. Standard placeholders are in the table below:
| Placeholder | Description |
|---|---|
%h | Client IP address (remote host). |
%l | Remote logname (identd if provided). |
%u | Remote user (for authenticated requests). |
%t | Timestamp. |
%>s | Request status after Apache processing. |
%b | Response size in bytes. |
%{Referrer}i | Incoming referrer header. |
%{User-Agent}i | Incoming user agent. |
The nickname is a quick way to reference the format in the CustomLog directive. Add fields, string literals, and C-style control characters to further customize the output.
Log Rotation
Log rotation is the process of archiving and managing logs. Over time, log files grow large and consume disk space. Large log files impact server performance and should be archived and managed regularly.
Apache provides built-in log rotation mechanisms. One such mechanism is the rotatelogs utility. Pipe the utility to the ErrorLog and CustomLog directives and specify the log file name format.
The program location is necessary, but it may differ between systems. Use the following command to see the program path:
which rotatelogs
The command prints the exact path in the console and appears in the syntax for log rotation:
[directive] "|[rotatelogs path] [log path] [time interval or size]"An example error log rotation for error logs looks like the following:
ErrorLog "|/usr/bin/rotatelogs ${APACHE_LOG_DIR}/error.log.%Y-%m-%d_%H-%M-%S 10"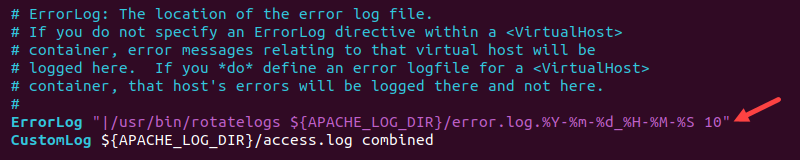
Where |/usr/bin/rotatelogs is the piped program path, ${APACHE_LOG_DIR}/error.log.%Y-%m-%d_%H-%M-%S is the log path with an added timestamp, and 10 is the interval in seconds.
Conditional Logging
Conditional logging enables filtering and selecting logs based on specific request attributes. To enable and use conditional logging, do the following:
1. Enable the mod_log_config module in the Apache configuration file:
LoadModule log_config_module modules/mod_log_config.so2. Use the SetEnvIf directive to set an environment variable based on an attribute. The general syntax is:
SetEnvIf [attribute] [regex] [variable]An attribute is an HTTP request header field, a request attribute, or another environment variable. The regex matches against the attribute, while the variable is the name with an optional value. For example:
SetEnvIf Request_URI "^example$" dontlogThe directive matches against the provided pattern path and sets the variable (dontlog) to a non-empty value if matched.
3. Add the variable to the CustomLog directive. For example:
CustomLog ${APACHE_LOG_DIR}/access.log combined env=!dontlog
The directive writes log entries when the dontlog variable is empty.
4. Save and close the configuration file.
5. Restart the Apache service to apply the changes:
sudo systemctl restart apache2Using conditional logging in Apache enables focusing on only the relevant logs, improving logging efficiency and data analysis.
Converting Logs to JSON
JSON is a structured, standardized format that simplifies integration with other systems. Many monitoring tools provide built-in methods to work with JSON format data. There are numerous different tools, scripts, and methods to convert log data into JSON format:
- Scripting. A scripting language like Python or Bash combines regular expressions, string manipulation, and line-by-line file parsing to convert log data into JSON objects. The approach provides complete control over the conversion process but requires additional effort to handle specific cases.
- Command-line tools. Command-line tools such as
jqor awk don't require extensive programming knowledge to convert the log text into a JSON object. Use this approach for quick conversions and one-time tasks. - Log collector frameworks and software. Frameworks and log parsing software, such as Apache Flume or Logstash, are robust solutions with data conversion functionalities. These solutions enable direct ingestion of log data from Apache and parsing it into JSON for downstream systems or storage platforms.
Logging Modules in Apache
Apache's logging modules expand the HTTP server's logging capabilities by enabling administrators to customize the logging mechanism. These modules load dynamically at startup, and administrators choose which modules to add or remove.
The sections below explore the standard Apache server logging modules and their contribution to server logging.
mod_log_config
The mod_log_config module enables server administrators to have granular control over logging data. The main features are:
- Custom log formats. It enables
LogFormatandCustomLog, which formats how a single log entry looks in a log file. - Conditional logging. Directives such as
SetEnvIfallow administrators to log only those entries that pass a custom-defined condition.
By enabling mod_log_config, administrators control logging behavior and focus on their specific strategy, such as tracking particular data, compliance, or disk space optimization.
mod_log_debug
The mod_log_debug module enables troubleshooting and debugging features in Apache logs. It records debugging data related to internal operations, requests, and module interactions. The module enables selecting the debugging level and error category based on specific situations and needs.
Enabling mod_log_debug provides insight into how Apache handles requests. This information is valuable when troubleshooting server configuration.
mod_log_forensic
The mod_log_forensic module specializes in forensic analysis and auditing. It captures client data before and after processing the request, creating two logs for each request. This data is crucial in post-incident investigations.
Due to high granularity, the module is critical in investigating security incidents, unauthorized access, and abnormal server behavior.
mod_logio
The mod_logio module records input and output traffic information. Administrators use these logs to monitor request processing and server bandwidth use.
By tracking request metrics, the module provides data transfer insights, enables informed resource allocation decisions, and improves server efficiency through bandwidth optimization.
mod_filter
The mod_filter module enables defining powerful log filters based on custom criteria. It analyzes various request and response attributes and enables the creation of detailed logging policies based on request and response data.
The main feature of this module is the ability to apply multiple sequential filters and create custom filters. The module also enables dynamic filtering and real-time adjustment of logging policies based on varying conditions.
mod_unique_id
The mod_unique_id module generates unique identifiers (UUIDs) for each logged server request. The UUIDs are a reliable mechanism for tracking unique requests. The identifiers are crucial for administrators when resolving complex server issues.
A UUID provides a way to track, correlate, and analyze individual requests. It provides a way to view a request's interaction with the server and improves incident response for critical issues.
Apache Log File Integrity Monitoring
A critical aspect of Apache logging is to monitor file integrity. Check the log file state and ensure the log data is accurate, functional, and secure.
Good practices when monitoring Apache log file integrity include the following aspects:
- Verification. Regular and automated log file verification involves comparing current log files with a previously saved checksum or hash. Doing so regularly helps detect any file alterations, tampering attempts, or corruption.
- Security. Robust security measures help prevent file deletion and unauthorized access. Permission-based access control minimizes file access to only the necessary personnel. Additionally, implementing encryption methods for both at-rest and in-transit prevents tampering attempts.
- Monitoring. Continuous monitoring tools provide real-time insights and activity. The tools easily detect changes to log files and suspicious activity. Administrators set up system alerts to notify of changes to log files that deviate from regular patterns.
- Compliance. Log file monitoring requires adherence to data security and compliance requirements. The files should align with the organization's regulations, such as HIIPA, GDPR, PCI, etc.
How to Use Data from Apache Log Files
Apache quickly generates large volumes of data with valuable information. The best way to utilize this data is to gain insight into server performance, user behavior, and security issues. Examples of how to use data from Apache log files include:
- Traffic analysis. Analyzing log data helps gain insight into website visits, peak traffic times, visitors' geographic locations, and frequently accessed pages. Analyzing traffic data found in Apache log files helps identify traffic trends, which is crucial for marketing and UX improvements.
- Performance monitoring. Monitoring performance helps detect performance issues, such as server errors or slow-loading pages. It includes analyzing log data to calculate the server response time and resource use.
- User behavior analysis. Analyzing log data provides various insights into browsing behavior and user data. The logs show browsing habits, session duration, and navigation paths, which are crucial in user behavior analysis.
- Security monitoring. By analyzing log data, administrators detect suspicious activity and mitigate security threats. The log files provide insight into unauthorized access attempts (such as brute-force attacks) and enable administrators to take appropriate security measures.
Log Piping in Apache
Log piping in Apache directs data from the Apache HTTP server to an external program, software, or script for further analysis. Since log data is bulky and hard to read, external solutions provide an improved view and simplify the extraction of practical information in real time.
The key ideas when log piping in Apache are:
- Setup and configuration. Setting up log piping involves configuring external log data redirection. Administrators should specify the log format and destination in the Apache configuration file. The destination should be set up to receive the piped log data and any additional permissions.
- Program choice. Picking the appropriate software solution is crucial to get the most out of Apache logging. The main aspects to consider when choosing a program are compatibility with Apache log formats, support for real-time processing, and scalability.
Conclusion
This guide provided methods for extracting data from Apache log files and for utilizing the generated data. The access.log file is an excellent resource for measuring how clients interact with the server. The error.log file helps troubleshoot issues with the web server.
Next, see our list of the SIEM (security information event management) tools, which go hand-in-hand with Apache log files.