The Graphics Processing Unit (GPU) is one of the most temperature-sensitive components in any computer system. Its performance depends on how it handles heat during gaming, 3D rendering, machine learning, deep learning, or other more intensive GPU computing workloads.
High GPU temperatures cause throttling, instability, and long-term damage. Therefore, monitoring these temperatures to ensure stable performance and system reliability is crucial.
This guide will explain why GPU temperature matters, the optimal temperature range, how to check it on any operating system, and how to keep it within safe limits.
Why Does GPU Temperature Matter?
The GPU temperature determines how efficiently a GPU performs and how long it will last. Overheating leads to instability and physical damage that reduces a GPU's lifespan.
GPU temperature is important because it affects:
- Performance. When a GPU exceeds its safe range, it automatically lowers clock speeds to reduce heat output, a process known as thermal throttling. This limits performance because it reduces frame rates, slows computation, and increases rendering times.
- Hardware wear. Consistent high temperatures stress the card's physical components. The video memory (VRAM) and voltage regulator module (VRM) are especially vulnerable, as excessive heat accelerates wear and increases the risk of voltage instability or memory errors.
- System stability. Overheating often causes application crashes or spontaneous reboots as the GPU fails to maintain stable operation.
- Power and cooling efficiency. Prolonged heat increases power draw and forces fans to run at higher speeds, which consumes more energy and creates additional wear.
- Component safety. Uncontrolled temperatures damage nearby components such as the VRM, motherboard, or power connectors, leading to full system failure.
What Is Optimal GPU Temperature Range?
The optimal temperature range for a graphics processing unit depends on its design, cooling system, and workload. Modern GPUs operate safely between 30°C and 85°C under load, but some high-end models can briefly reach 95 to 100 °C. Temperatures above these levels may indicate a cooling problem or thermal stress.
The table below summarizes general GPU temperature ranges and their meanings.
| Temperature Range | Description | Impact |
|---|---|---|
| 30°C to 40°C | Idle or light load temperatures. | Normal, stable operation. |
| 65°C to 85°C | Moderate to heavy load temperatures. | Expected under gaming, rendering, or similar workloads. |
| 85°C to 90°C | High temperatures. | Indicates potential cooling issues. Prolonged heat may degrade components. |
| Above 90°C | Critical temperature point. | Risk of throttling, instability, or permanent hardware damage. |
Note: Some high-end GPUs tolerate short spikes up to 100°C, but prolonged exposure risks throttling or hardware damage
Laptop GPUs run hotter than desktop models due to their compact cooling systems and limited airflow. Keeping ambient temperatures low and ensuring unobstructed ventilation is especially important in portable devices.
Maintain your GPU within the recommended range to prevent performance drops, preserve long-term hardware integrity, and reduce unnecessary fan wear.
How to Check GPU Temperature
Monitoring GPU temperature is essential to maintain optimal performance and prevent overheating. Different operating systems (OSs) provide varying levels of built-in support, and some GPUs also offer vendor-specific tools.
This section covers both Graphical User Interface (GUI) and command-line methods of checking GPU temperature on Windows, macOS, and Linux.
Note: Intel integrated GPUs generally do not expose temperature telemetry on any operating system. This affects both graphical and command-line monitoring methods, so readings for Intel iGPUs are often unavailable or only approximate.
Check GPU Temperature on Windows
Windows 11 provides several ways to monitor GPU temperature, including built-in and external tools.
However, dedicated and integrated GPUs differ in how they expose temperature readings:
- Dedicated cards from NVIDIA and AMD support temperature data in Task Manager and through vendor utilities.
- Integrated graphics, such as Intel Iris Xe or UHD models, do not expose temperature readings in Windows. Monitoring the CPU package temperature provides an approximate indication of thermal behavior during GPU activity.
Therefore, if you have a dedicated card, take the following steps to view GPU temperature using the GUI:
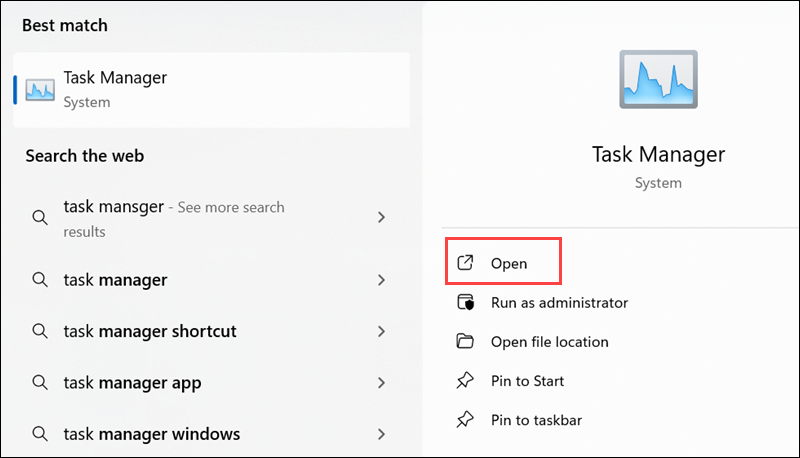
1. Open Task Manager.
2. Select the Performance tab.
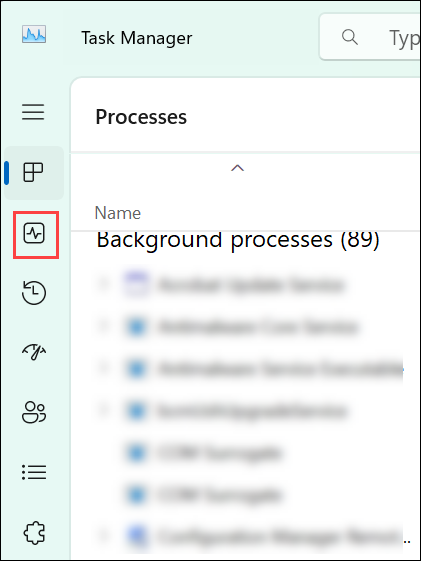
3. Choose GPU from the sidebar.
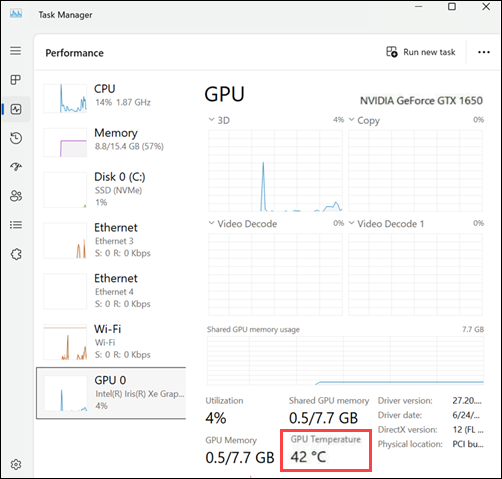
The current temperature appears in the lower-right corner of the window, along with utilization, memory, and power data. This feature works only with dedicated GPUs that use the latest AMD or NVIDIA drivers.
For detailed metrics such as fan speed, VRAM temperature, and power consumption, use vendor-specific tools. Examples include NVIDIA GeForce Experience for NVIDIA GPUs and AMD Radeon Software for AMD GPUs. These provide fan curves, detailed temperature readings, and power management options
Windows also supports command-line monitoring for NVIDIA GPUs with the nvidia-smi utility. To check GPU temperature, open PowerShell or Command Prompt, and type:
nvidia-smi --query-gpu=temperature.gpu --format=csv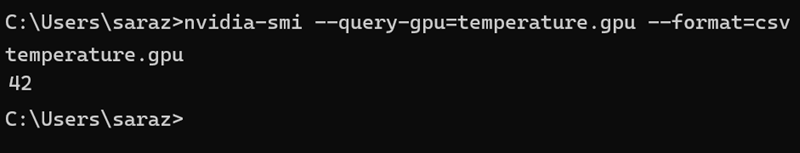
The output lists the current temperature in Celsius for each installed NVIDIA GPU. This method is available only on systems with NVIDIA cards and official drivers.
Note: Running nvidia-smi without query parameters displays a detailed table that includes temperature, utilization, memory usage, and power data for each installed NVIDIA GPU.
Check GPU Temperature on macOS
macOS does not provide a built-in GUI method to monitor GPU temperature, and vendor utilities do not expose real-time temperature readings. While earlier macOS versions allowed users to view GPU temperature with powermetrics, current releases no longer expose GPU temperature data through any command-line interface.
To check GPU temperature, you need third-party applications. However, even with the third-party apps, the accuracy depends on the GPU type:
- On Macs with Intel integrated GPUs, temperature telemetry is not exposed, so readings may be unavailable.
- On Apple Silicon Macs, temperature monitoring is limited. Readings are approximate because the GPU is integrated into the system-on-chip (SoC), and Apple does not expose full telemetry.
Check GPU temperature on Linux
Linux provides several ways to monitor GPU temperature with GUI and command-line tools.
Most modern desktop environments include basic hardware monitoring tools. On Ubuntu and similar distributions, GUI tools such as Psensor display GPU temperature when configured correctly.
Note that Intel integrated GPUs don't expose temperature telemetry on Linux, as they do on other OSs, and Psensor won't show GPU temperature on this setup.
However, if you have an NVIDIA or AMD driver, Psensor provides real-time charts for GPU, CPU, and other components.
Take the following steps to get GPU temperature readings:
1. Install Psensor with apt:
sudo apt install psensor
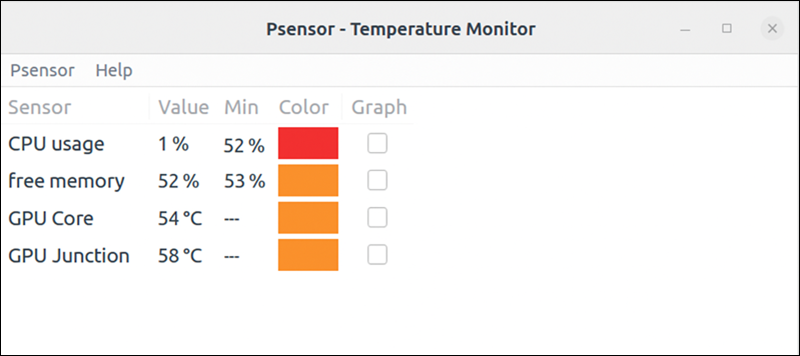
2. Open Psensor and enable the GPU temperature sensor in the preferences.
3. Check the readings in the main window alongside other data.
Other graphical methods include vendor-specific utilities, such as NVIDIA X Server Settings or AMD Radeon drivers.
To check GPU temperature from the terminal, use one of the following methods depending on your hardware:
- NVIDIA GPUs. Use the
nvidia-smiutility to display temperature and performance data. The command shows the current temperature in Celsius for each installed GPU. Run the following command:
nvidia-smi --query-gpu=temperature.gpu --format=csvWhen run without parameters, nvidia-smi provides a full performance summary, including temperature, utilization, and memory usage.
- AMD GPUs. Use the
lm-sensorspackage to read data directly from the hardware. Execute the following to install and run the feature:
sudo apt install lm-sensors
sudo sensors-detect
sensors
Follow prompts in sensors-detect to detect hardware sensors. After detection, use sensors to view GPU temperature
Intel also offers Intel GPU Tools. However, they only display GPU load and frequency, but temperature telemetry is unavailable for Intel integrated graphics.
Some desktop environments and extensions also display GPU temperature in the system tray, which provides continuous monitoring through the same underlying sensor data.
Long-Term Risks of High GPU Temperature
Prolonged high GPU temperatures cause gradual hardware degradation even when performance appears normal. Long exposure to excessive heat reduces reliability, shortens component lifespan, and increases the risk of permanent damage.
Long-term thermal stress leads to:
- Solder fatigue. Repeated heating and cooling cycles weaken the tiny solder joints that connect the GPU die and memory chips to the circuit board, which causes intermittent or permanent contact failures.
- Component aging. Continuous heat accelerates the breakdown of semiconductor materials in transistors and degrades electrolytic capacitors, which stabilize voltage.
- Fan wear. High temperatures force cooling fans to spin at maximum speed for extended periods, which wears out the bearings that support the fan blades and leads to increased noise or mechanical failure.
- Thermal pad and paste degradation. Heat exposure causes thermal compounds to dry out and lose conductivity, which reduces heat transfer efficiency between the GPU and its cooler.
- Power supply stress. Sustained heat increases power draw and places additional strain on voltage regulators and the power supply unit (PSU), which leads to system instability or shutdowns.
How to Reduce GPU Temperature
Keeping GPU temperatures within a safe range requires proper cooling, maintenance, and power management.
The following measures help lower GPU temperatures and maintain stable performance under load:
- Improve airflow. Clean dust from fans, filters, and vents, and ensure adequate space around the case for proper airflow.
- Reapply the thermal pad and paste. If the GPU is several years old, replace the thermal pads and compound between the chip and heatsink to restore heat transfer efficiency.
- Adjust fan curves. Use vendor-specific software to set more aggressive fan profiles when temperatures rise.
- Lower power limits. Reduce voltage or power draw through undervolting to decrease heat output without significant performance loss.
- Check the case configuration. Ensure intake and exhaust fans are correctly oriented and cables do not obstruct airflow.
- Control ambient temperature. Keep the room cool and don't place the system near heat sources.
- Clean regularly. Dust buildup is one of the most common causes of rising GPU temperature over time.
GPU Temperature Monitoring and Regulation: Best Practices
Regular temperature monitoring helps detect cooling or performance issues early, before they cause permanent damage.
The following list presents best practices to maintain stable operation and consistent thermal performance:
- Monitor periodically. Check GPU temperature during gaming, rendering, or stress testing to identify unusual spikes or irregular fan behavior.
- Use trusted software. Stick to vendor tools or well-maintained open-source utilities that accurately report temperature and power data.
- Keep drivers updated. Driver updates often improve fan control algorithms and thermal management efficiency.
- Avoid unnecessary overclocking. Aggressive overclocks increase voltage and heat output, which reduces component lifespan.
- Maintain system cleanliness. Clean fans, heatsinks, and vents at least once every few months to sustain consistent cooling performance.
- Monitor ambient temperature. High room temperature directly increases GPU heat levels. Keep proper ventilation in the environment.
- Test after hardware changes. After replacing thermal paste, upgrading fans, or changing cases, verify temperatures under load to ensure cooling improvements are effective.
Conclusion
This tutorial explained why GPU temperature and its optimal range are important. It also elaborated on different ways to check GPU temperature using GUI or CLI methods on various operating systems. The article also presented the risks of high GPU temperatures, ways to reduce them, and best practices to follow.
Next, learn about high-performance computing in which GPU computing plays an important role.