Storage performance and Input/Output Operations Per Second (IOPS) are foundational metrics for understanding and optimizing system responsiveness. Measuring and analyzing these parameters is critical to ensuring efficient and responsive application and system operations.
Depending on your environment, there are different ways to measure storage performance and IOPS.
This article covers the steps and examples of measuring storage and IOPS performance on Windows, Linux, and vCenter.
Prerequisites
- Access to the relevant platforms (Windows/Linux server).
- Access to the VMware vCenter environment.
- Command-line access.
Understanding Storage and IOPS Performance
Storage performance measures the speed and efficiency of read and write operations on storage devices. It encompasses several different metrics to determine storage efficiency. The metrics are crucial factors that indicate how quickly applications respond and how quickly data is retrieved and stored.
Among many different parameters, IOPS (Input/Output Operations Per Second) is a vital metric for measuring storage performance. The value represents the total number of read and write operations a storage device handles per second. IOPS directly affects the responsiveness of applications and services.
Many factors affect IOPS performance, and it's critical to understand everything that influences these values. Elements that impact IOPS measurements include:
- Hardware. The underlying infrastructure hardware plays a significant role in IOPS performance. This includes the storage device type (HDD, SSD), CPU, and memory type.
- File systems and software. File system choice and software configurations impact how data is accessed and stored.
- Workload. The type of workload significantly affects IOPS performance. Different application types, data access mechanisms, and the number of read and write operations differ between workloads.
Therefore, the specific IOPS values differ across computing environments due to differences in the elements.
Measuring Storage and IOPS Performance on Windows
The following steps outline how to measure IOPS performance on a Windows server:
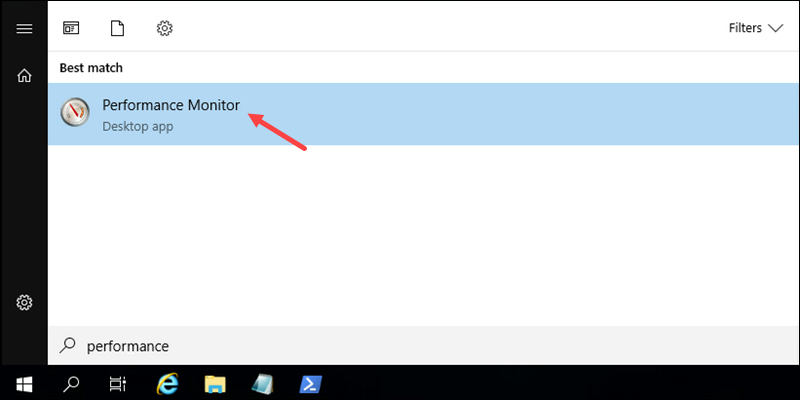
1. In the Start menu, search for Performance Monitor and open the application.
2. In the left menu, expand Data Collector Set. Right-click User Defined and choose New->Data Collector Set.
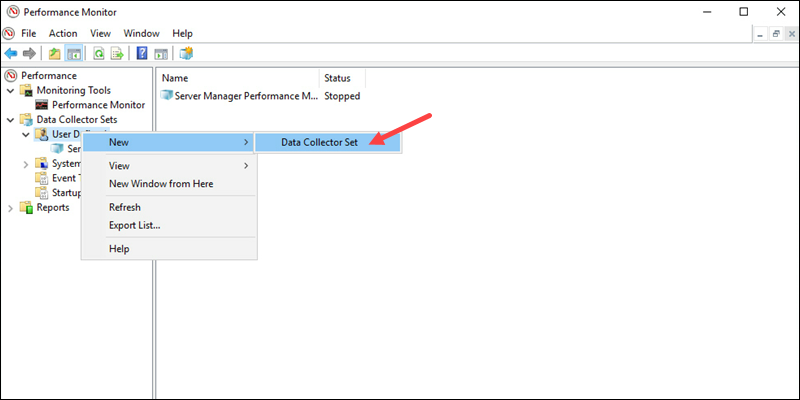
The Data Collector Set wizard starts.
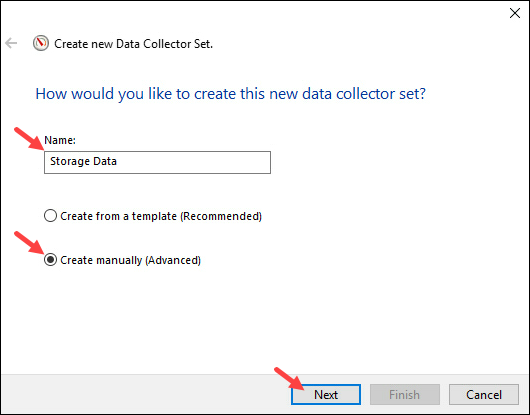
3. Enter a descriptive set name. Choose Create manually (Advanced) and click Next to proceed.
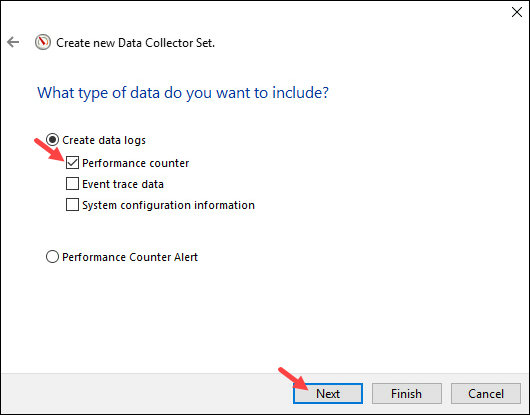
4. Tick the Performance Counter checkbox and click Next.
5. Click Add to open the performance counters list.
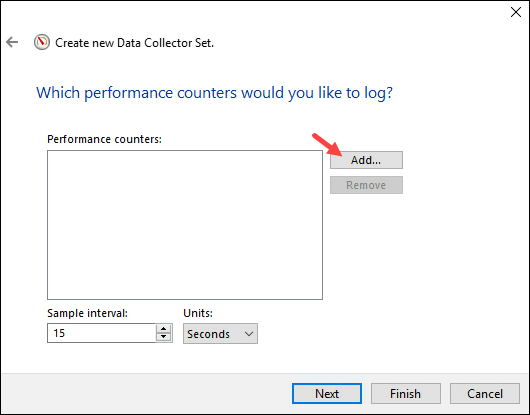
6. Choose performance counters to log. To monitor disk usage, locate and expand the PhysicalDisk list. Locate each of the following parameters and click Add >> to add them to the counters list:
- Avg Disk Bytes/Transfer. Average disk throughput.
- Avg. Disk Queue Length. Average number of queued read/write requests.
- Avg. Disk Sec./Transfer. Time required for one read/write operation.
- Disk Bytes/sec. Total disk throughput per second.
- Disk Transfers/sec. Number of read/write operations per second (IOPS).
- Split IO/sec. Number of split operations per second (disk fragmentation indicator).
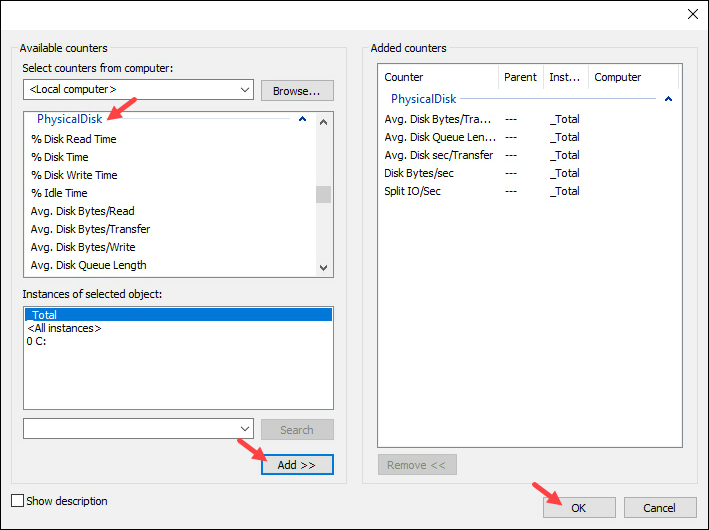
Click OK to confirm the selection.
7. Choose a Sample interval. The sample interval measures each counter at the specified interval.
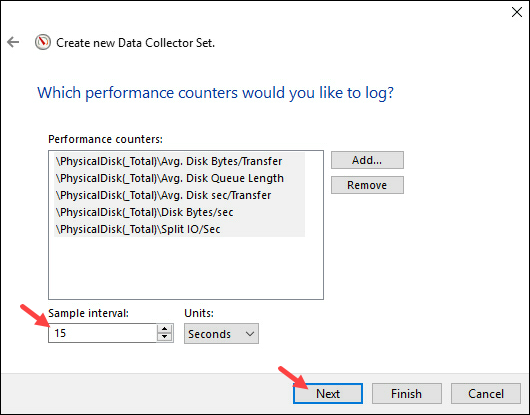
Click Next to proceed.
8. Select the root directory. The performance monitor saves the data to the specified location. Click Next to continue.
9. Choose the user account to run the data collector set. Use an account with administrator privileges.
On the same page, select Start this data collector set now to start collecting data immediately. Alternatively, pick Save and close and run the collector during peak hours.
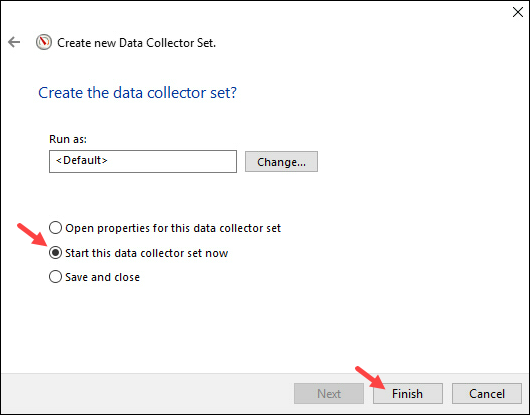
Click Finish to complete the creation of the data collector set.
10. The data collector set shows as Running.
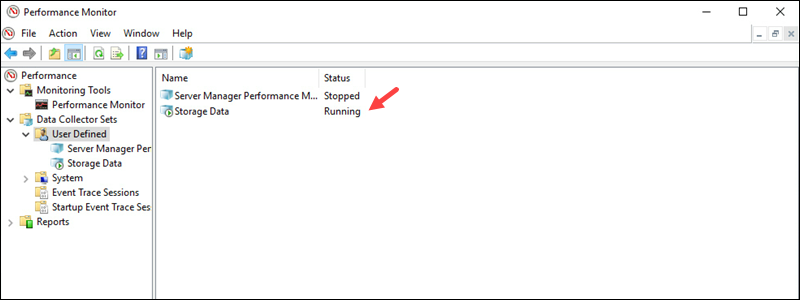
If you selected the Save and Close option during creation, right-click the set and choose Start.
11. The collector runs until terminated. To stop the collection and view the data, right-click the collector set and choose Stop.
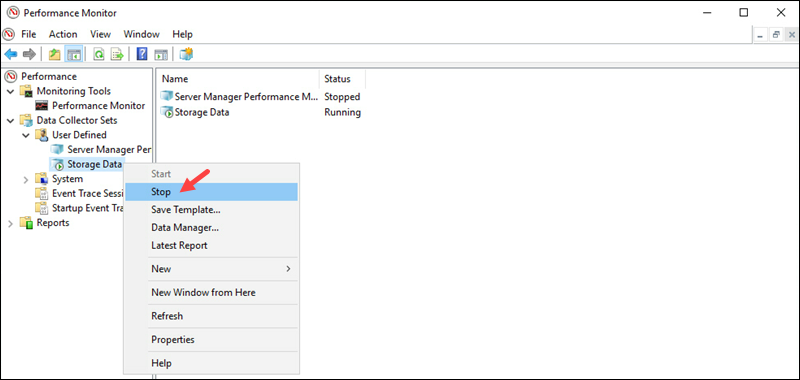
The action generates an output report. The report is saved to the location specified during collector set creation.
12. To view the report from the Performance Monitor window, open Reports->User Defined->[Set name]->[Report name].
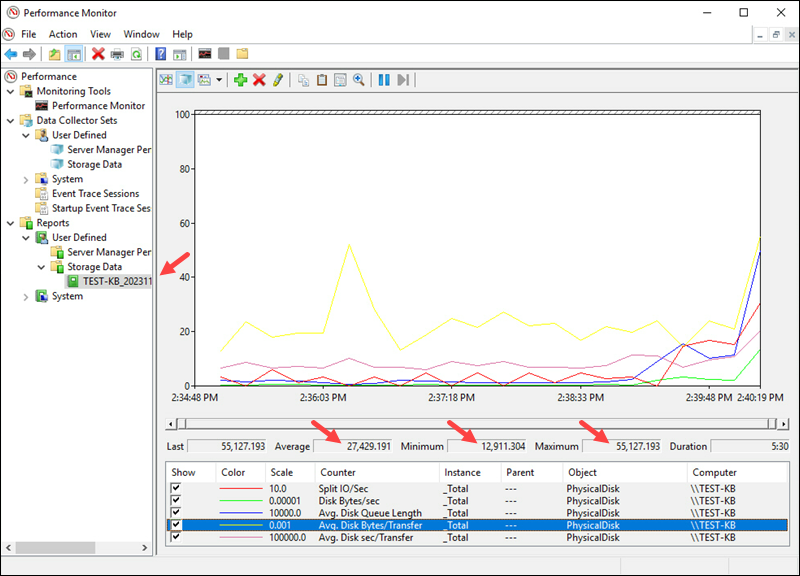
The graph and data are shown in the right panel. Selecting a parameter shows the exact values, including the average, minimum, and maximum values over the measurement period.
Measuring Storage and IOPS Performance on Linux
Linux provides several tools to monitor storage and IOPS performance. The steps below showcase how to use the iostat command to view and collect IOPS performance data:
1. The iostat command is part of the sysstat package. To install it, run:
sudo apt install sysstatWait for the installation to complete.
2. Check the disk name using the lsblk command:
lsblk | grep disk
The first column shows the disk name. Save the name for the following commands.
3. To see how the command works, run the following:
iostat -d -k 1 1 [disk name]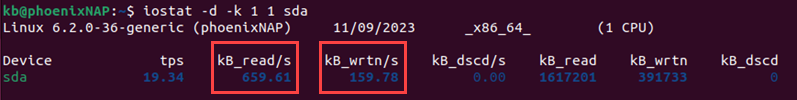
The -d parameter shows the device utilization report, while the -k parameter displays statistics in kilobytes per second. The numbers indicate the time interval in seconds and the number of samples to collect (in this case, one second and one sample).
The output shows various disk metrics for the provided device. The kb_read/s and kb_wrtn/s columns are necessary to calculate IOPS.
4. Extract the columns using the awk command:
iostat -d -k 1 1 [disk name] | awk '/[disk name]/ {print "Read: " $(NF-5) ", Write: " $(NF-4)}'
The $NF parameter helps access the final column and counts backward to fetch the correct information.
5. To calculate the average read and write operations over multiple samples, use the following example command and provide the number of samples and disk name:
iostat -d -k 1 [samples] [disk name] | awk '/[disk name]/ {read+=$(NF-5); write+=$(NF-4)} END {print "Read Avg: " read/[samples] ", Write Avg: " write/[samples]}'
The command collects the samples every second and finds the average over the collection. For example, setting samples to 300 collects one sample per second over 300 seconds (five minutes).
Measuring Storage and IOPS Performance on vCenter
If you are using a virtualized workload with VMware vSphere, you need access to vCenter to monitor IOPS performance.
The steps below demonstrate how to install VMware PowerCLI and run a PowerShell script that collects and shows IOPS data for each disk per VM:
1. Open PowerShell as an administrator.
2. Install the PowerCLI module with the following command:
Install-Module VMware.PowerCLI -scope CurrentUser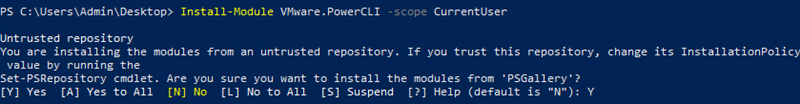
Press Y to accept the installation and wait for it to complete.
3. Connect to vCenter using the following command:
Connect-VIServer -Server [Server name|IP]A dialog pops up, prompting you to enter the access information. Provide the username and password for your vCenter account.
4. In case of certificate errors, change the default configuration using the following command:
Set-PowerCliConfiguration -InvalidCertificateAction Ignore -Scope -CurrentUser5. Save the following script into a .ps1 file:
$metrics = "virtualdisk.numberwriteaveraged.average","virtualdisk.numberreadaveraged.average"
$start = (Get-Date).AddMinutes(-5)
$report = @()

$vms = Get-VM  | where {$_.PowerState -eq "PoweredOn"}
$stats = Get-Stat -Realtime -Stat $metrics -Entity $vms -Start $start
$interval = $stats[0].IntervalSecs
$hdTab = @{}
foreach($hd in (Get-Harddisk -VM $vms)){
    $controllerKey = $hd.Extensiondata.ControllerKey
    $controller = $hd.Parent.Extensiondata.Config.Hardware.Device | where{$_.Key -eq $controllerKey}
    $hdTab[$hd.Parent.Name + "/scsi" + $controller.BusNumber + ":" + $hd.Extensiondata.UnitNumber] = $hd.FileName.Split(']')[0].TrimStart('['),$hd.CapacityKB}

$report = $stats | Group-Object -Property {$_.Entity.Name},Instance | %{
    New-Object PSObject -Property @{
        VM = $_.Values[0]
        Disk = $_.Values[1]
        DiskSizeKB = $hdTab[$_.Values[0] + "/"+ $_.Values[1]][1]
        IOPSMax = ($_.Group |
            Group-Object -Property Timestamp |
            %{$_.Group[0].Value + $_.Group[1].Value} |
            Measure-Object -Maximum).Maximum / $interval
        Datastore = $hdTab[$_.Values[0] + "/"+ $_.Values[1]][0]
    }
}

$report
The script collects the average number of read-and-write operations per virtual disk on powered-on VMs over a five-minute period.
Modify the $start variable to use a different time interval or the $metrics variable to collect different parameters.
6. Run the script with:
./[Script Name].ps1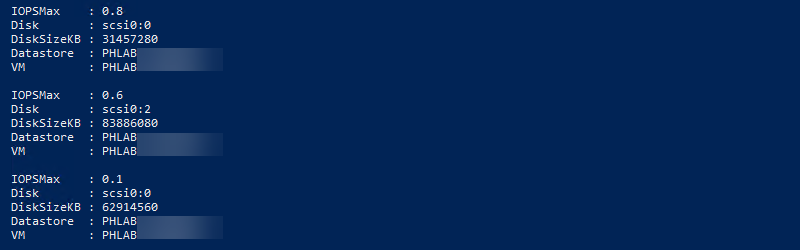
The output shows the collected disk IOPS data for all powered-on VMs in the following format:
- IOPSMax. The maximum IOPS during the specified time interval.
- Disk. The specific disk instance within the virtual machine.
- DiskSizeKB. The size of the disk in Kilobytes.
- Datastore. Name of the data store where the disk is located.
- VM. Name of the virtual machine.
Note: For VMs or disks with high IOPS, consider switching the storage to an optimized solution.
If you're a phoenixNAP customer, consider changing the VM or disk policy to HPE Alletra All-NVMe. For more info, see our detailed overview of the HPE Alletra All-NVMe storage solution.
Conclusion
This guide showed you several ways to measure storage performance and IOPS. Collect data during peak hours to assess storage performance during critical moments.