The syslog (system logging) protocol is used for monitoring network devices and sending log messages to a logging server (a syslog server).
The syslog server and syslog protocol work together to facilitate log tracking and management.
In this article, you will learn what a syslog server is, what it is used for, and see the best syslog servers available for Linux and Windows.
What Is a Syslog Server?
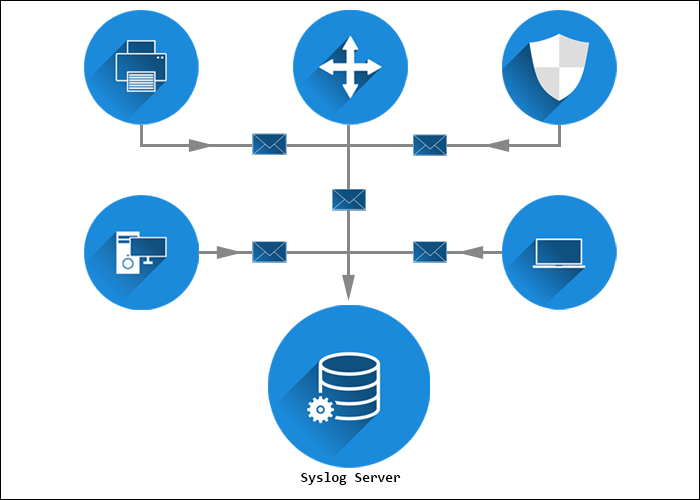
A syslog server collects syslog messages from all devices in a single location, whether they are bare metal servers, virtual machines, or software services. The syslog server usually consists of a syslog listener that receives and interprets incoming data, and a database for storing it.
The server collects, filters, and displays the collected messages from all devices and operating systems. A syslog server can usually store the logs for a long time.
Advanced syslog servers provide automated notifications and tailored responses to detected issues - i.e., to run a script, filter and forward a message, create and deliver a report, etc.
With all the benefits and features of a syslog server, it is easy to optimize device performance and health after analyzing server data.
Note: Deploy syslog software on one of our pre-configured Bare Metal Cloud server instances. Pick the OS supported by your syslog server, and deploy within minutes!
What Is a Syslog Server Used For?
A syslog server's primary purpose is to collect log messages from connected network devices and store them in a centralized location for monitoring. The server keeps logs in a consistent format, making it easy for users to spot performance irregularities.
Use a syslog server to improve network monitoring and management by inspecting network specifics and parameters. Automate actions by setting up automatic alerts about a variation in a device's data log. Some syslog servers include a message severity indicator.
The benefits of using a syslog server and logging data are:
- Reduced number of alerts.
- Reduced downtime.
- Fewer business interruptions.
- Preventive troubleshooting.
Finally, syslog servers can store event logs for a long time, enabling access to historical events. Various syslog servers rotate logs and create new files periodically, thus keeping the data organized.
Note: Securely connect to a syslog server by enabling passwordless SSH login.
Syslog Servers for Linux and Windows
This section lists the most popular and feature-rich Linux and Windows syslog servers. For a comparison of supported platforms and free trial availability, refer to the table below:
| Syslog Server | Supported Platforms | Free Trial |
|---|---|---|
| Kiwi | Unix, Linux, Windows | 14 days |
| PRTG | Windows | 30 days |
| Syslog Watcher | Unix, Linux, Windows | Per request |
| The Dude | Linux, macOS, Windows | / |
| Visual Syslog Server | Unix, Linux | / |
| Datagram | Windows | Unlimited trial version |
| ManageEngine EventLog Analyzer | Linux, Windows | / |
| Icinga | Unix, Linux | / |
| GrayLog | Linux | / |
| WinSyslog | Windows | / |
| Nagios | Linux, Windows | 30 days |
| Splunkbase | Unix, Linux, Windows | 14 days |
| Progress WhatsUp Gold | Windows | 14 days |
| Logstash | Unix, Linux, Windows | 14 days |
| Loggly | Cloud-based | 30 days |
| Site24x7 | Cloud-based | 30 days |
Free Syslog Servers
The following section lists the best free syslog servers:
1. Kiwi Syslog Server
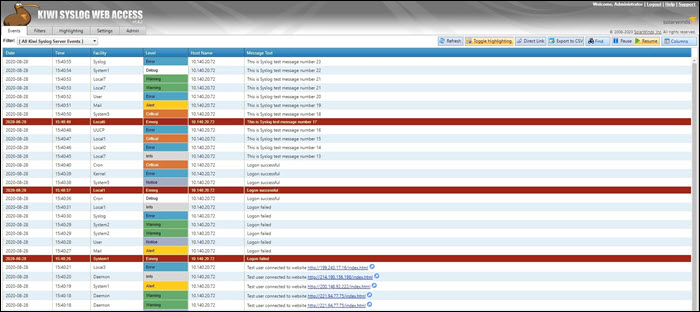
The Kiwi syslog server was created by SolarWinds. It is a comprehensive logging utility that collects syslog events and messages on Unix, Linux, and Windows and generates reports in plain text or HTML.
Kiwi's GUI allows users to easily and efficiently manage logs in a single place. The tool can create network traffic graphics and, optionally, send daily summary emails.
The free edition collects syslog messages from up to 5 devices and lets you set alerts for various events, including heavy traffic, login attempts, hardware failures, etc. Additionally, Kiwi allows archiving syslog messages or forwarding them to a database. The free version includes a 14-day trial of full functionality.
The full version costs $329 and offers automation, allowing you to set up actions triggered by specific events, as well as a web-based interface for remote management.
2. PRTG Syslog Server
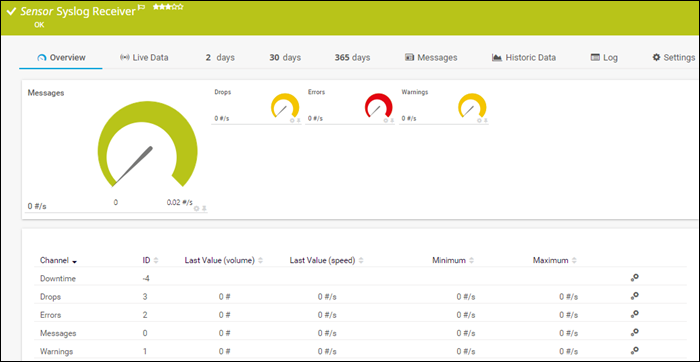
The PRTG syslog server is part of the PRTG Network Monitor application, and it is completely free for up to 100 sensors. The free trial allows users to use more sensors for 30 days, but later reverts to the free version. The Syslog Receiver sensor for monitoring and analyzing network traffic doesn't require additional software installations.
PRTG can receive and process up to 10,000 syslog messages per second from network devices and Windows environments. The number depends on the processing power, storage, and overall system configuration.
PRTG offers an intuitive web interface for viewing, analyzing, and filtering syslog messages by type, severity, etc. It also provides message categorization and further filtering to ensure only relevant messages are displayed.
The server offers automation by sending alerts triggered by errors, warnings, or a high number of messages.
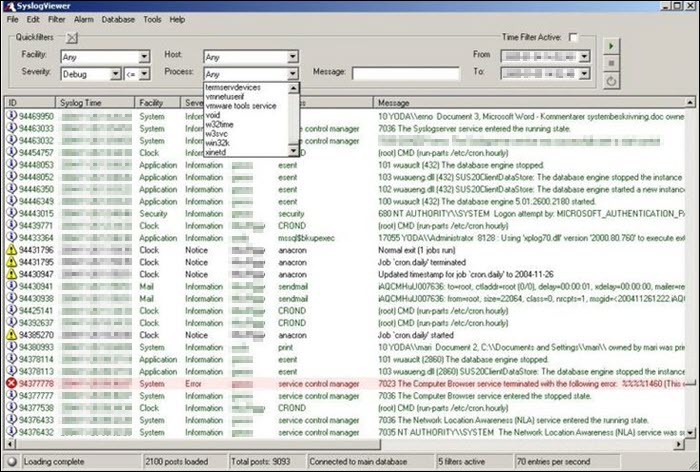
3. Syslog Watcher
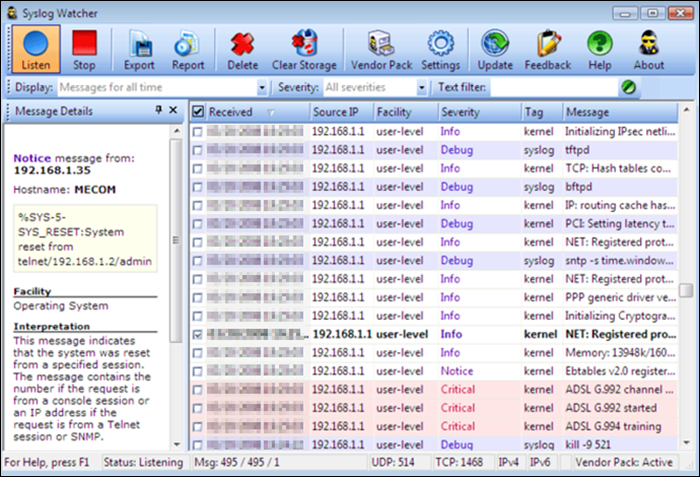
The SNMPSoft Syslog Watcher is a dedicated syslog server compatible with various devices and software that support syslog sending. The tool collects system log events from Unix, Windows, or Linux servers.
The free version allows collecting syslog messages from 5 sources, while the professional version supports an unlimited number of sources. Depending on the configuration, Syslog Watcher can handle up to 5,000 syslog messages per second.
Syslog Watcher can collect messages over UDP and TCP and supports IPv4 and IPv6 networks. The utility also enables automation by sending email alerts for specific errors, events, or messages.
Message filtering, storage, and customization depend on filters, the message severity level, and the user-defined rules. Syslog Watcher also offers exporting messages to a database, manually or automatically.
4. The Dude
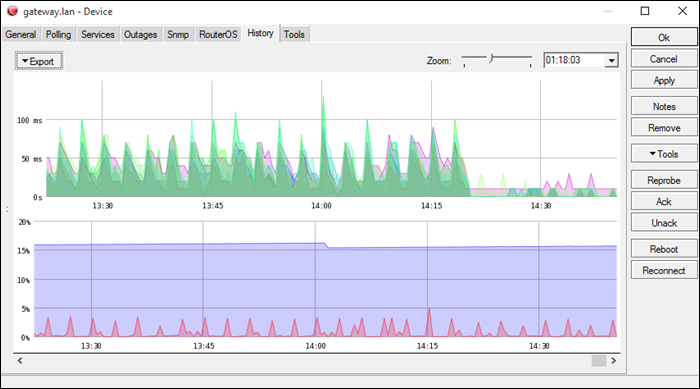
The Dude is a network management application developed by MicroTik, with a free built-in syslog server. The application offers general network management, while the syslog server captures syslog messages from your devices.
The Dude supports remote logging via RouterOS. It is compatible with Windows-based systems; on Linux or macOS, it runs with Wine/Darwine.
The server automates maintenance by allowing users to create alerts for specific syslog events or messages and to filter them.
It includes an auto-discovery feature that automatically maps nearby devices on the network, facilitating network building.
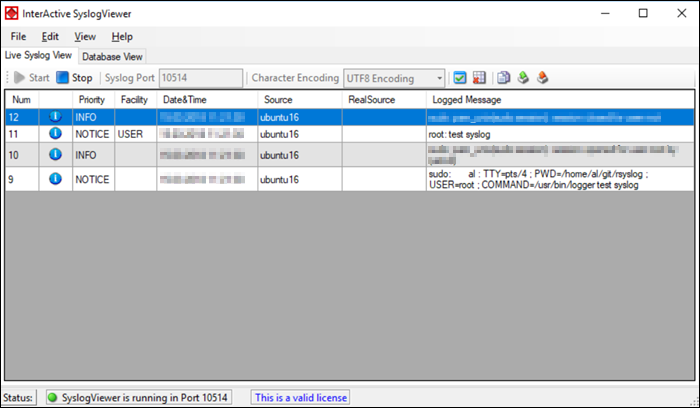
5. Visual Syslog Server
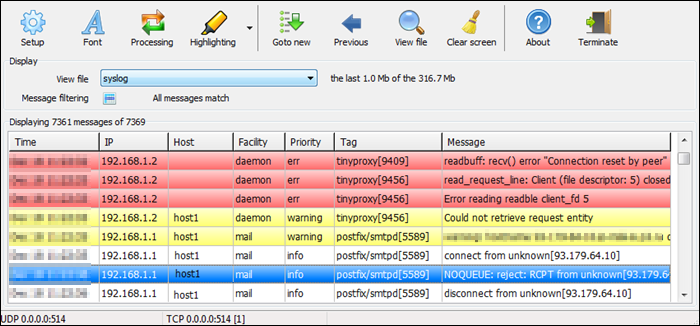
Visual Syslog Server is a free, lightweight Windows-based syslog server that monitors incoming data in real time. It accepts messages via UDP and TCP and stores them on a disk. Previous syslog messages remain on the disk for future analysis as long as the user specifies.
Message filters include filtering based on the host, source address, priority, facility, or message content. Filtering makes it easier to find issues when dealing with large data volumes.
Users can also configure thresholds to trigger script execution, program execution, or email notifications. Thus, the tool automates problem-solving and reduces response time for pressing issues.
6. Datagram
The Datagram Syslog Server is part of the Datagram SyslogServer Suite. Its Datagram SyslogAgent is installed as a service on Windows clients and servers, supporting Windows 2000 or newer systems.
The program provides enterprise-level functionality, capable of log collection, message filtering, alerts, database storage, and log viewing.
The GUI is intuitive and offers a live network view. The filters include the hostname, process, facility, issue severity, message, or even custom SQL queries.
The trial version is free, supports eight logging IP addresses, but supports the Microsoft Access database only. Entries cannot be backed up or deleted, and there are no email notifications. Users can create up to 10 filters and set up to 10 alarms.
On the other hand, the enterprise version costs $200 for 50 IP addresses, $500 for 500, and $900 for 5,000 IP addresses. The enterprise version allows users to back up or delete entries, supports MSSQL databases, and imposes no limit on the creation of filters or alarms. It also supports email notifications.
7. ManageEngine EventLog Analyzer

The ManageEngine EventLog Analyzer is a tool that allows you to monitor up to 5 devices for free. It is compatible with Windows and Linux, while monitoring works for various devices running any operating system.
The EventLog Analyzer provides a GUI with a real-time log view and comparison, enabling quick detection of suspicious messages and potential security threats. The functional dashboard enables users to create custom rules for alerts and notifications about security issues. There are also predefined rules for security event logs.
The auto-discovery feature finds devices on the network and facilitates log collection. Each message is labeled, making it clear which device it came from.
Compression and encryption of archived logs restrict data access to users without administrator privileges.
8. Icinga
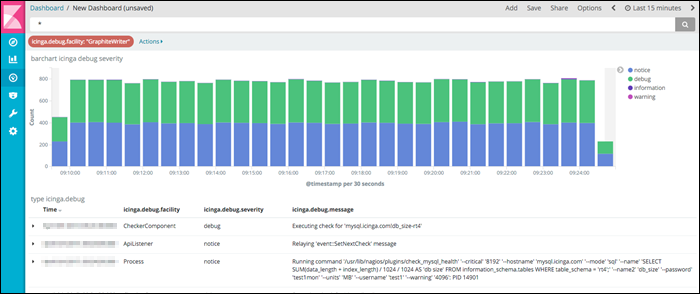
Icinga is an open-source tool that monitors and reports on device health. This syslog server supports various modifications to fit any organization's network monitoring needs.
The syslog tool collects, stores, and organizes data in a time-series database, displaying both historical and current syslog data. It instantly notifies the user of any suspicious data, helping prevent downtime and enabling event-based monitoring.
Icinga's web interface provides charts and graphs that depict device health, optimizing troubleshooting and debugging. Its integration with other devices facilitates real-time data collection, storage, and visualization of log metrics.
9. GrayLog
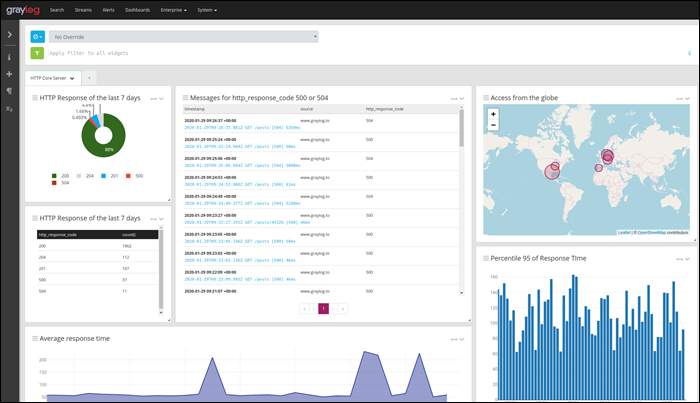
GrayLog is an open-source syslog server for Linux. The tool offers 5 GB of data per day for free, making it an excellent choice for small networks, but it isn't suitable for large organizations.
The server includes a query and search function with many filters that enable users to quickly find a specific record. The program interface consists of a fully customizable web GUI with graphs, charts, and configurable core components to create a custom day-to-day monitoring environment.
The server has robust security features, including automatic email notifications for failed logins, device faults, or security threats. With built-in automatic IP blocking, GrayLog can prevent an attack as soon as it is detected.
The app also offers fault tolerance, audit logs, and role-based access control, further enhancing security.
10. Windows Syslog Server
WinSyslog is a syslog server designed for Microsoft Windows. It supports syslog monitoring via UDP or TCP, and it is free for displaying 60 messages at a time, with free troubleshooting support. Paid versions unlock additional features, provide greater security, and offer unlimited device support.
WinSyslog is reliable, highly scalable, and collects syslog messages from any device compatible with the syslog protocol. It maintains device health via the Active Status Monitor, which pings the selected device and warns the admin if there is no response.
The server creates a daily log containing the received syslog messages, with customizable size and storage options. Store the file in a database or write it to the Windows NT, 2000, or XP event log.
The program also includes automatic email notifications in the event of a security issue.
Paid Syslog Servers
The following is a list of the best paid syslog servers:
1. Nagios Log Server
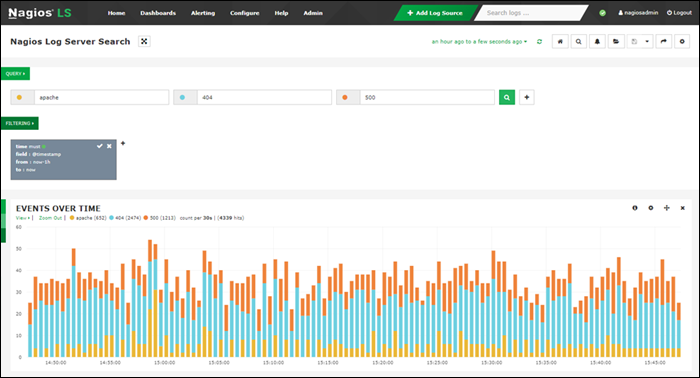
Nagios is a scalable syslog server that helps monitor systems, networks, and infrastructure. While it offers a free plan, it is limited to 500 MB/day, making it unsuitable for medium- and large-sized businesses.
Other pricing plans are:
- Single Instance. For $1,995, it covers only one installation, which excludes failover. With this purchase, the data plan is unlimited.
- Two Instances. Costing $4,995, it covers two separate installations, which allow for redundant data with automatic failover.
- Four Instances. Costing $6,995, it allows four separate installations, further increasing redundancy and speeds.
- Ten Instances. At $14,995, it supports 10 installations with maximum redundancy and query performance.
The server can receive logs from a wide variety of operating systems and devices, including Windows, Linux, mail servers, Web and application servers, SQL servers, etc. It is customizable, with configurable thresholds, email notifications, script execution, or alert forwarding.
The dashboard provides an overview of all logs over time, with customizable filters that include the timestamp, ID, host, message, severity, program, etc. The tool generates reports that are also customizable and automatically update in real-time.
2. Splunkbase
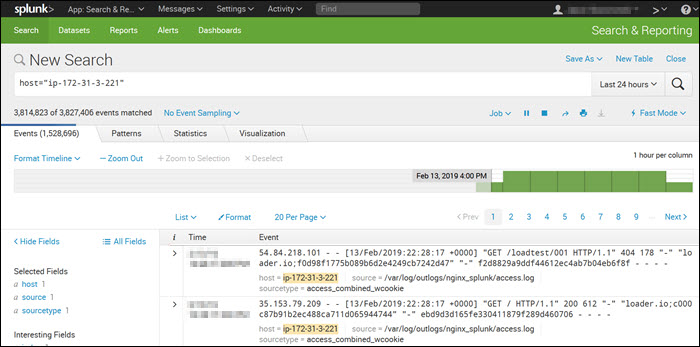
Splunk is a syslog server used for monitoring, querying, analyzing, and visualizing log data in real-time. It is a paid tool with a 60-day free trial that includes syslog features. The server is compatible with Linux and macOS.
Splunk costs $1,150 per GB of data for a yearly 15 GB license, including maintenance.
Splunk features an intuitive and user-friendly UI with real-time statistics and a customizable dashboard.
It includes powerful search functionality and filters that narrow results to the messages the user needs, such as error or device-specific messages. Splunk allows users to perform Boolean, quoted-string, and wildcard searches in real time, across time ranges, or at the transaction level.
3. Progress WhatsUp Gold Log Management
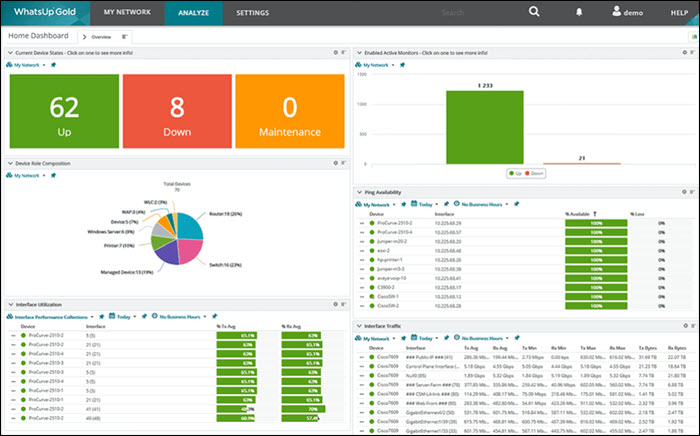
Progress WhatsUp Gold (formerly IPSwitch) is a paid syslog server with a free 14-day trial. The syslog management tool is an add-on to the WhatsUp Gold monitoring tool for Windows Server and also receives Windows Event messages.
The pricing plans differ between subscription and perpetual licenses. For example, the pricing plans for a 1-year license include:
- 5 Servers - $1,325
- 10 Servers - $2,300
- 25 Servers - $5,250
The logging tool receives the log and Windows event messages and files them together. If there are sudden out-of-band increases or decreases, the tool creates an alert and notifies the user.
The customizable drag-and-drop dashboard displays messages in real time as they arrive. Color-coded icons and graphs improve the visibility of each message's severity, allowing the team to react immediately.
WhatsUp's interactive interface shows each device's availability and performance, both on-premise and in the cloud.
4. Logstash
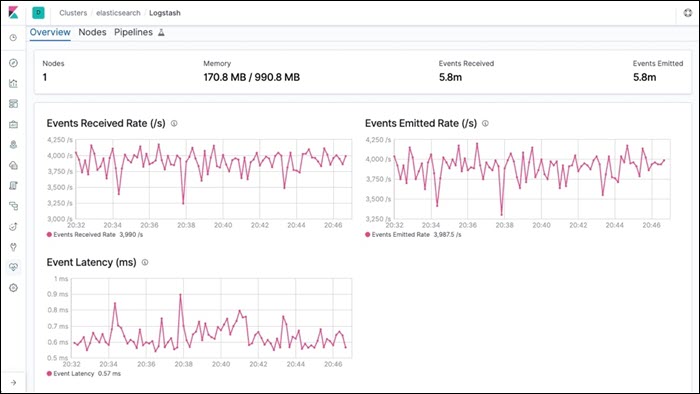
Logstash is part of a software suite called ELK stack that collects log messages. One part of the stack, Elasticsearch, sorts and filters the messages for analysis, while Kibana processes and displays the data. All technologies in the ELK stack are Linux-based, but work on macOS as well.
Logstash comes in four pricing plans:
- Standard. For $16 per month.
- Gold. Costs $19 per month.
- Platinum. Costs $22 per month.
- Enterprise. Contact the sales team for a quote.
Logstash listens on the network for messages coming from a wide variety of devices, but also supports collecting data from cloud services and applications. It collects logs via TCP or UDP, and it also supports TLS-encrypted messages.
Note: Learn how to deploy the Elastic stack on Kubernetes.
Logstash can read messages from a file or database, get messages from mail servers, IRC or RSS feeds, and pick up SNMP messages. The filters allow users to find specific messages and quickly resolve any issues.
The front-end part of the ELK stack, Kibana, works well for any syslog server.
5. Loggly
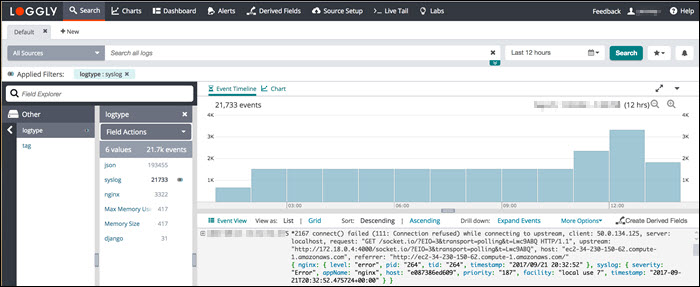
Loggly is a cloud-based syslog consolidator and analyzer. It doesn't require software installations on-premises, but requires setting up automated file transfer procedures that upload the logs to the Loggly server.
The utility comes in four pricing plans:
- Lite. Free, includes 200 MB/day, and retains data for seven days.
- Standard. Starting at $79/month, it limits data to 1 GB/day and retains data for 15 days.
- Pro. Starting at $159/month, data volume is up to 100GB/day, and retains data for up to 30 days.
- Enterprise. With a starting price of $279/month, it includes a custom data volume and retains the log data for up to 90 days.
Loggly standardizes and stores syslog messages from many sources, allowing users to access the data uniformly. Once the data is stored, it is accessible via the log analysis tools in the online service.
Loggly includes storage space with the software purchase, but since it stores data remotely and off-site, it is good to back up the log files on another site to improve system security. Data retention depends on the purchased package.
6. Site24x7 Server Monitoring
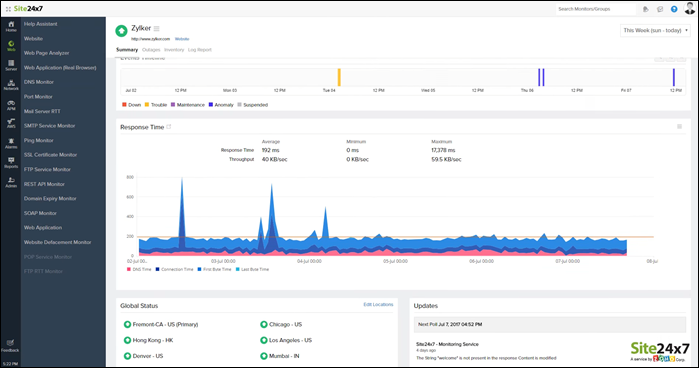
Site24x7 is a cloud-based monitoring and management software suite that includes the Log Manager. The Site 24x7 Infrastructure utilities offer a 30-day free trial. A monthly subscription comes with a 500 MB log processing allowance costing $9, with the following possible upgrades:
- 10 GB. Costs $10 per month.
- 100 GB. Costs $95 per month.
- 1 TB. Costs $900 per month.
Although the system is cloud-based, a Site24x7 agent must be installed on the monitored system for the Log Manager to work. The agent is compatible with Linux and Windows server.
When receiving syslog messages, the server standardizes them and stores them in the same format. Message standardization allows users to analyze messages from different sources together.
The dashboard includes many data analysis options in the log file viewer, including log querying, sorting, filtering, and grouping messages.
How to Choose a Syslog Server?
There are several factors to consider when choosing a syslog server:
- Business Size. A paid syslog server is probably a better choice for a large enterprise due to the data volume and device number restrictions of free servers. On the other hand, a free syslog tool can provide the necessary functionality for small businesses with few devices and low data volume.
- Support. If your organization doesn't have skilled IT staff or if you need help setting up the software, a paid tool usually includes support and troubleshooting assistance. Some free utilities also include basic documentation but don't offer round-the-clock support or troubleshooting.
- Storage. A better choice for businesses with their own storage capacities are syslog servers sold as a software suite, which are installed on-premises. An on-premises option improves security and lowers the chance of a data breach. On the other hand, some syslog tools are sold as a cloud-based syslog service, which is a good choice if you don't have your own storage.
Conclusion
This article listed the 16 best syslog servers, their benefits, features, capabilities, and pricing. You should now be able to decide which syslog server is best suited to your organization.