Data plays a crucial role in business decision processes. Analyzing data is what transforms data into decisions. The two most popular programming languages in data science, visualization, and data analysis are R and Python.
The choice between R and Python is a strategic decision, as both languages have a distinct approach to data analysis. Knowing each language's advantages and limitations enables newcomers and professionals to make informed decisions and choose the right tool for the job.
This article provides an in-depth comparison between R and Python.
What Is R?
R is an open source statistical computing programming language created by university professors Robert Gentleman and Ross Ihaka in 1993. R is a successor to the S programming language, and the name "R" is also based on the first names of the two creators.
The language specializes in statistics, data science, and research. It offers an extensive package collection that simplifies statistical methods, visualizations, and data manipulation. Although less popular than Python, the programming language excels at these tasks and has a specialized user community.
Advantages of R
Below are some of the advantages of R:
- Advanced statistics tools. R provides many statistical techniques which are familiar to data analysts. The additional packages are often user-made by a specialized statistics-oriented community. Examples include statistical tests, time series analysis, clustering, classification, etc.
- Data visualization. The programming language is known for creating publication-level visualizations. Graphs, plots, and charts are fully customizable and visually appealing.
- Community-driven. R has a thriving and specialized community that actively participates and contributes to package creation. Users can find packages for any statistical task.
Disadvantages of R
Some of the disadvantages of R are:
- Steep learning curve. R has a unique syntax and a high focus on statistics. Beginners may find the language hard to grasp and learn.
- Performance limits. Computationally intensive tasks and large datasets affect the performance speeds.
- Limited applications. Since R specializes in statistical computing, there are fewer general-purpose use cases. The language is less versatile compared to Python.
Note: Learn how to find standard deviation in R or learn about confusion matrix in R.
What Is Python?
Python is a general-purpose programming language known for simplicity and readability. The language was created by Guido Van Rossum in 1992, and it is currently one of the most popular languages in various programming domains. The name "Python" is a reference to Monty Python.
In the world of data science and analytics, Python has several packages for statistical computing. Since it is a general-purpose language, there are also other use cases for Python. Examples include machine learning and web development tools.
Advantages of Python
The advantages of using Python are:
- Simplicity. The language is known for being readable and having a straightforward syntax. Python code is close to the English language, making it simple to read and learn, even for beginners.
- Versatility. Since Python is a general-purpose programming language, it has broader applications that combine well with data analysis, such as machine learning and web development.
- Performance. Compared to R, Python performs better when working with large datasets and computationally intensive tasks.
Disadvantages of Python
Some disadvantages of Python include the following:
- Visualization. When compared to R, Python has fewer visualization capabilities. Achieving the same quality visualizations is more difficult in Python.
- Steep learning curve. Although the language is simple, data analysis tasks can be challenging. Knowing which library to use and how to accomplish a specific task requires diving deep into documentation.
- Fewer statistics tools. Python has fewer statistics-based tools compared to R due to being a general-purpose language.
R vs. Python
R and Python have many similarities as programming languages. Both languages are:
- Interpreted.
- Dynamically typed.
- Extendible with packages and libraries.
However, there are some key aspects where the two programming languages are different. The infographic below shows some of these critical differences.
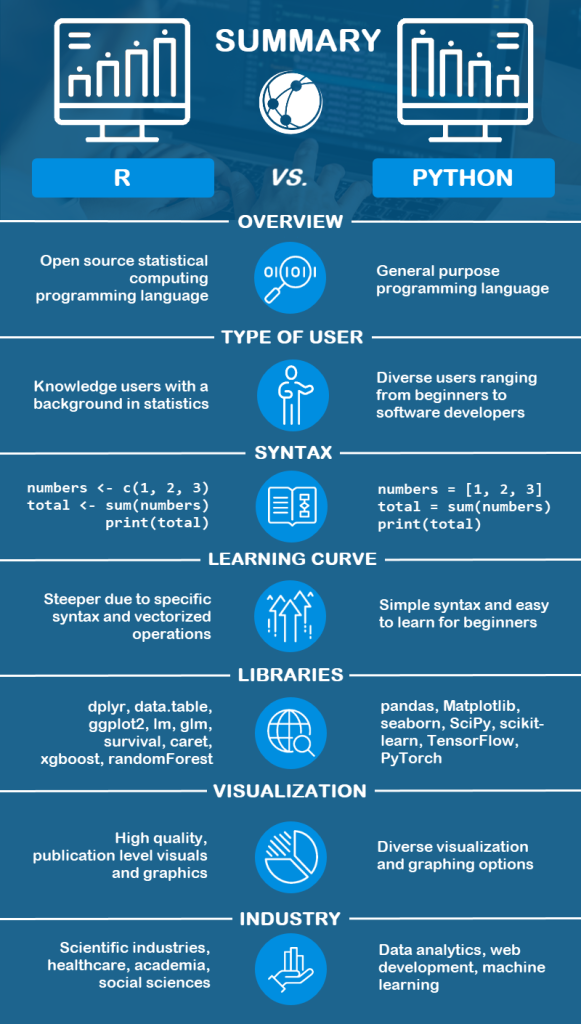
The characteristics outlined in the sections below provide a detailed head-to-head comparison between R and Python in these crucial aspects.
Type of User
R. Typical users of R are those with a strong statistics background. The language is commonly used by expert users, such as researchers, statisticians, and mathematicians. The key reason this group prefers the language is due to dedicated statistics libraries and data analysis capabilities.
Python. Python users are a diverse group. As one of the most popular languages, it attracts a broader user base, such as data analysts, software engineers, web developers, and data scientists. The reason for such a user group is Python's simplicity and general-purpose nature.
Syntax
R. R's syntax caters to statistics and data analysis tasks. The language uses vectorized operations and focuses on data manipulation. Although the syntax is less intuitive to a non-statistician, it provides various statistics and data science tools.
Example syntax:
# R code to calculate the sum of a vector of numbers
numbers <- c(1, 2, 3, 4)
total <- sum(numbers)
print(total)
The code does the following:
- Line 1. All comments in R begin with a hash symbol (
#). - Line 2. R uses vectors as its main data structure and
->as an assignment operator. - Line 3. Built-in functions, such as
sum(), help calculate the sum of all elements in a vector. - Line 4. The
print()function shows the resulting variable.
Python. Python is famous for having a clean and readable syntax, which is an advantage in data analysis tasks. It aims for simplicity and consistency, making learning accessible regardless of previous experiences.
Example syntax:
# Python code to calculate the sum of a list of numbers
numbers = [1, 2, 3, 4]
total = sum(numbers)
print(total)
Each line of code does the following:
- Line 1. The hash symbol (
#) starts a comment in Python. - Line 2. Python uses lists to group numbers and the equals sign (
=) as an assignment operator. - Line 3. The
sum()function is a built-in function that helps calculate the sum of all numbers in a list. - Line 4. The built-in print() function helps show the variable result.
Learning Curve
R. The language is a powerful tool for statistical analysis and visualization. Learning the intricacies of R is more straightforward for someone with a statistics background. Vectorized operations and statistical packages may be complex to learn for newcomers. R has a strong community presence and numerous online learning resources.
Python. Python is known for its simplicity and readability, making it an easy-to-learn language for people with no coding experience. It has a broader application than data analysis, which provides learning opportunities for tasks outside of data analysis. There are abundant resources, courses, and online learning materials to simplify the learning process.
Libraries
R. The programming language features many libraries to accomplish various data science tasks. Some notable libraries are included in the table below.
| Task | R Library |
|---|---|
| Data manipulation | dplyr data.table |
| Visualization | ggplot2 |
| Statistics | lm glm survival |
| Machine learning | caret xgboost randomForest |
| Text manipulation | tm quanteda |
| Big data and distributed computing | SparkR sparklyr |
Python. Python features many libraries and packages for data science and analysis. Commonly used libraries for these tasks are listed in the table below.
| Task | Python Library |
|---|---|
| Data manipulation | pandas |
| Visualization | Matplotlib seaborn Plotly |
| Statistics | SciPy statsmodel |
| Machine learning | scikit-learn TensorFlow PyTorch |
| Text manipulation | NLTK spaCy TextBlob |
| Big data and distributed computing | Dask PySpark |
Note: See our in-depth comparison between TensorFlow and PyTorch.
Graphics and Visualization
R. The language is known for generating high-quality, publication-level visualizations. Static graphs and standard statistical plots are simple to create for a wider audience. Many packages further provide specialized visualizations, ggplot2 being the most prominent.
Overall, creating visualizations in R is user-friendly and features a diverse choice of packages. Typical libraries for creating visuals include plotly, shiny, lattice, ggvs, and many others.
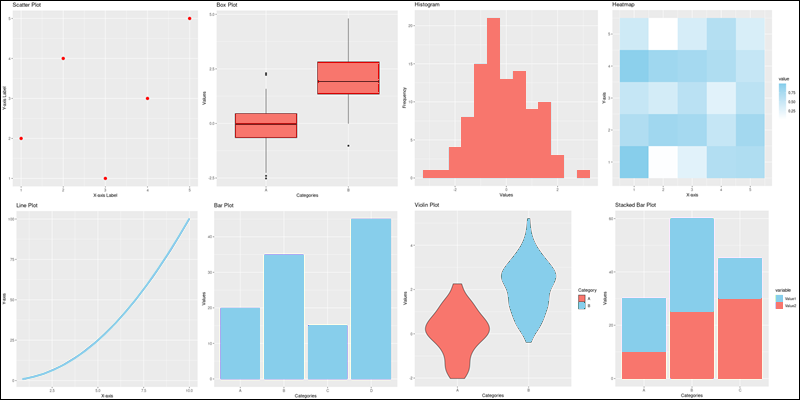
Python. Python, like R, features diverse data visualization libraries. The most prominent is matplotlib, which helps create highly customizable plots, graphs, and chats.
Other libraries offer broader applications, such as statistical graphics through seaborn or interactive visualizations through bokeh. Jupyter Notebook, a popular Python environment for data analysis, integrates these libraries for in-line plotting.
Data Analysis
R. R is designed for data analysis and statistics, which is why it is one of the most prominent tools for these tasks in the field. Its syntax caters to data manipulation tasks but also statistical modeling and testing.
One of the most notable features is a collection of open-source packages called Tidyverse. The collection contains data science packages that use a similar approach to model, transform, and visualize data.
Python. Python is widely used in data analysis due to its powerful data manipulation and extensibility. One of the essential libraries for this task is Pandas, which provides data filtering, cleaning, and transformation functions.
In addition to basic data analysis tasks, Python features many machine learning and deep learning frameworks that enable predictive analysis.
Use Cases
R. The main use cases of the R language are in the list below:
- Statistical analysis. Due to its powerful statistics toolkit, R is the preferred choice among statisticians and researchers. The language simplifies statistical tasks, such as hypothesis testing and regression analysis.
- Data visualization. R is the go-to tool for generating professional visualizations. The visuals are highly customizable and result in high-quality data overviews.
- Data transformation and cleaning. Filtering, reshaping, and summarizing data is consistent and simple through Tidyverse. R is an excellent choice for data manipulation tasks.
- Academics and research. R is popular in research-based organizations and academic institutions. It is particularly prominent in social science, economics, bioinformatics, and epidemiology.
Python. Python's most prominent use cases include the following:
- Data analysis. The key library for data analysis (Pandas) provides specialized data structures such as Series and DataFrames to simplify data transformation.
- Machine learning and deep learning. Python excels at predictive analytics through its diverse machine learning and deep learning libraries. It is the go-to language for creating and deploying machine learning models.
- Natural language processing. Several libraries, such as NLTK and spaCy, enable performing various NLP tasks. Examples include sentiment analysis, language modeling, and text analysis.
- Data science and business analytics. Python widely caters to and is suitable for businesses that require generating reports and insights from data.
Community Support
R. R has a dedicated community of knowledge workers, including data scientists and statisticians. The community actively maintains and reviews packages available through the Comprehensive R Archive Network (CRAN).
The community is equally active offline. Due to its popularity in the academic fields, numerous books and publications are dedicated to learning and applying R to various use cases. The R community also organizes conferences and workshops where the supporters share their knowledge and experiences.
Python. Python has one of the most extensive and diverse programming communities. Being a general-purpose language does not limit it to any specific field. As a result, a wide range of resources are available through documentation, blogs, and online communities.
Python is an actively developed language that keeps up with the latest technological changes. It has an equally active community that maintains and improves the quantity and quality of available libraries.
R vs. Python: How To Choose?
The choice between R vs. Python depends on several factors. To make an informed choice, here are some key things to consider when choosing between the two:
- Background and previous experience.
- R caters more to users with a statistics background.
- Python is better suited for users with previous programming experience.
- Project requirements.
- R's primary focus is on statistical analysis, visualization, and reporting.
- Python has a wider application, including machine learning, web development, and automation.
- Industry.
- R is commonly found in the scientific industries, such as healthcare and academia.
- Python is preferred in general data analytics, machine learning, and web development.
Consider which tool is easier to integrate into the existing environment if collaborating on a project. Both languages have abundant resources and are relatively simple to learn. Another consideration is using a hybrid approach to get the benefits of both languages.
Conclusion
After reading this guide, you know the key differences between R and Python. R is better suited for specialized statistical tasks, while Python is more versatile in its application. Both languages are considered giants in the data world, and the debate has no clear winner.
Looking to try both languages? Learn how to install R on Ubuntu and how to install Python on Ubuntu