The vmstat command (short for virtual memory statistics) is a built-in monitoring utility in Linux. The command is used to obtain information about memory, system processes, paging, interrupts, block I/O, disk, and CPU scheduling. Users can observe system activity virtually in real-time by specifying a sampling period.
The command helps you identify performance bottlenecks and diagnose problems in your system.
In this tutorial, you will learn how to use the vmstat command on Linux.

Prerequisites
- A machine running Linux
- An account with sudo/root privileges
Linux vmstat Command Syntax
The basic vmstat syntax is:
vmstat [options][delay [count]]- Options – various switches to customize the output.
- Delay – defines the time elapsed between output updates.
- Count – the number of output updates after the specified delay interval. If count isn't set, the default value is infinite.
The list of available options:
| Option: | Description: |
-a | Displays active and inactive memory. |
-f | Displays the number of forks since boot. |
-m | Displays slab statistics. |
-n | Displays the header only once rather than periodically. |
-s | Displays a table of various event counters and memory statistics. |
-d | Displays disk statistics. |
-D | Detailed disk activity report. |
-p | Detailed partition statistics. |
-t | Adds a timestamp to the report. |
-S [unit] | Switches output units. |
-V | Displays version information. |
-h | Displays help. |
man vmstat | Displays a user manual in the terminal. |
How to Use vmstat
The vmstat command is a part of sysstat, system monitoring tools, which generate CPU and device statistics and reports. The sysstat package is available on Linux by default.
1. If you don’t have vmstat on your machine, install it by running:
For CentOS and RHEL systems:
sudo yum install sysstatFor Fedora 22+ systems:
sudo dnf install sysstatFor Ubuntu and Debian based systems:
sudo apt-get install sysstatFor Arch Linux:
sudo pacman -S sysstat2. Enter your password and wait for the installation to finish.
3. Run vmstat without parameters to display a system report with average statistics since the last boot.
4. For additional reports, use vmstat options, delay, and count.
Basic vmstat Output
The basic output of the vmstat command displays system information in six sections.

1. procs – Process Statistics
- r – Active process count.
- b – Sleeping process count.
2. memory – Memory statistics
- swpd – Total virtual memory. The swap space is initially unoccupied. However, the kernel starts using swap space as the system’s physical memory reaches its limit.
- free – Total free memory.
- buff – Total memory temporarily used as a data buffer.
- cache – Total cache memory.
3. swap – Swap space Statistics
- si – The rate of swapping-in memory from disk.
- so – The rate of swapping-out memory to disk.
4. io – Input/Output Statistics
- bi – Blocks received from a block device per second.
- bo – Blocks sent to a block device per second.
5. system – Scheduling statistics
- in – The number of system interrupts.
- cs – The number of context switches per second.
6. cpu – CPU Statistics
- us – The percentage of CPU time spent on non-kernel processes.
- sy – The percentage of CPU time spent on kernel processes.
- id – The percentage of idle CPU.
- wa – The percentage of CPU time spent waiting for Input/Output.
- st – The percentage of CPU time stolen by a virtual machine.
Display Active and Inactive System Memory
Active memory is memory in use by a process. Inactive memory is memory that was allocated to a process that is no longer running.
Using the -a option replaces the buff and cache memory columns with inact and active columns. These columns display the amount of inactive and active memory in a system.
To view the information, run this command:
vmstat -a
The output shows memory statistics in kilobytes by default. To generate a report using megabytes, use the -S option.
Memory and Scheduling Statistics
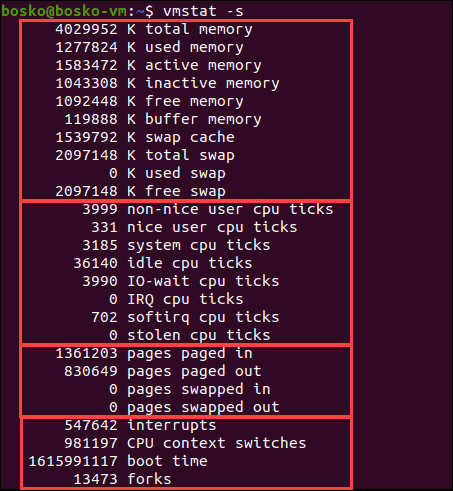
To generate more detailed information about memory, event counters, and CPU scheduling statistics, run the following command:
vmstat -s
The output shows a report similar to the vmstat basic report, with more details in some sections. For example, the output splits the nice and non-nice CPU time, which are combined in the basic vmstat report.
There are four sections in the output:
1. The first section of the output deals with the amount of used memory:
- Total physical memory.
- Currently used memory.
- Active memory.
- Inactive memory.
- Free memory.
- Buffer memory.
- Cache memory.
- Swap memory information.
2. The second section displays CPU statistics:
- Non-nice CPU ticks – the number of times the CPU was used for high-priority processes.
- Nice CPU ticks – the number of times the CPU was used for lower-priority processes.
- System CPU ticks – the number of times the CPU was used for kernel processes.
- Idle CPU ticks – the number of times the CPU was idle.
- IO-wait – the number of times the CPU was used for input/output management.
- IRQ – the number of times the CPU received interrupt requests.
- softirq – the number of times the CPU received software interrupts.
- stolen CPU ticks – the number of times a virtual machine stole CPU time.
3. The third section shows values related to memory paging:
- Total pages paged in from virtual memory.
- Total pages paged out to virtual memory.
- Total pages read from swap memory.
- Total pages written to swap memory.
4. The last section describes various event counters:
- The number of interrupts since boot.
- The number of context switches performed.
- The timestamp for the last boot time.
- The total number of forks.
Display Number of Forks Since Boot
Forks are new processes created from existing running ones. To see the number of forks created since system startup, run the following command:
vmstat -f
The output shows the number of forks created since system boot.
Display Quick Summary Disk Statistics
The -D option generates a quick summary statistic of all disk activity. Run the following command:
vmstat -D
The output shows the system details, such as the number of disks, partitions, the number of reads, writes, etc.
Note: If you are using Ubuntu, the disk count is usually higher than your actual number of disks. This is because installing Snap applications creates a SquashFS pseudo-filesystem, which is attached to a /dev/loop device, and vmstat counts it as a disk.
Display Disk Statistics (Read/Write Stats)
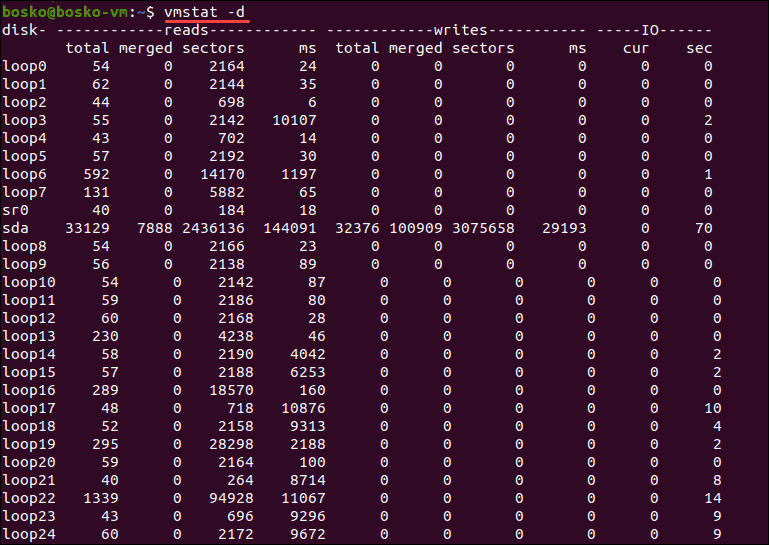
To get a detailed statistic on each disk usage, use the -d option:
vmstat -d
The output shows three columns for each disk - Reads, Writes, and IO. Read and Write are measured in milliseconds, while the IO column is measured in seconds.
Each column has several subsections:
1. Reads:
- total: The total number of disk reads.
- merged: The total number of grouped reads.
- sectors: The total number of sectors that have been read in.
- ms: The total number of time it took to read data from the disk, in milliseconds.
2. Writes:
- total: The total number of disk writes.
- merged: The total number of grouped writes.
- sectors: The total number of sectors written to.
- ms: The total number of time it took to write data to the disk, in milliseconds.
3. IO:
- cur: Total current disk reads or writes.
- sec: Time spent for any in-progress reads or writes, in seconds.
Display Partition Statistics
Generate a report related to a specific partition by using the -p option, followed by a partition name:
vmstat -p [partition_identifier]
In this example, the output shows the summary for sda1, the first partition of the sda device. The summary includes the disk read and write counts for that partition, as well as the total number of sectors involved in disk read and write tasks.
Display Timestamp Information for Updates
To get a timestamp along with a requested output, use the -t option:
vmstat -t
The output is the same as the basic vmstat output, with an added timestamp.
Use a Delay Value
The [delay] syntax specifies the time elapsed between each output update, expressed in seconds. Use the following syntax:
vmstat [delay]
In this example, there is a three-second delay between each report update.
If no delay is specified, only one output is printed, giving average values since the last reboot.
Note: A low delay value burdens the system because it runs the command infinitely until you stop it manually with the Ctrl+C key combo. To avoid the extra load, use a count value along with a delay value. The syntax is vmstat [delay[count]], and it is explained in detail in the following section.
Use a Count Value
The count value lets vmstat know how many updates to carry out before the output stops refreshing. To run a command an infinite number of times, omit the [count] syntax.
The syntax for using the count value is:
vmstat [delay[count]]
In this example, we specified a 5-second delay and 3 output updates.
Change Units
The default unit for displaying memory and swap statistics is kilobytes. To change the output units, use the -S option and one of the following arguments:
- k: 1000 bytes.
- K: 1024 bytes.
- m: 1000000 bytes.
- M: 1048576 bytes.
To display the statistics in decimal kilobytes and megabytes, use k and m, respectively. Upper case K and M display statistics in hexadecimal kilobytes and megabytes.
For example, use the following command to update the statistics every 5 seconds and to change the display units to megabytes:
vmstat 5 -S M
The output now shows the memory and swap statistics in megabytes.
Display Statistics for Slabs
Slab allocation is a memory management system for efficiently allocating memory to various data objects that the kernel handles.
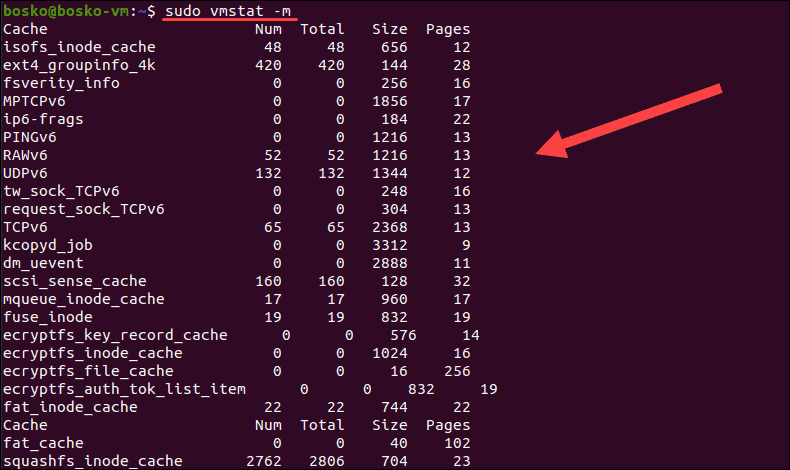
To see slab statistics, use the -m option. Note that this action requires superuser permissions. Run the following command:
sudo vmstat -m
The output consists of five columns:
1. Cache: Cached data name.
2. Num: Total active objects in the Num cache.
3. Total: The number of available objects in a specific cache.
4. Size: The size of each cached object.
5. Pages: The number of memory pages containing a cached object.
Conclusion
Now you know how to use the vmstat command in Linux. The guide showed how to use the various options to customize your output and see the statistics you need to diagnose a problem.


