The Linux perf tool is a lightweight command-line utility for profiling and monitoring CPU performance on Linux systems. Although the tool is simple, it provides in-depth information that helps in analyzing CPUs.
The command contains many subcommands for collecting, tracing, and analyzing CPU event data.
This guide demonstrates the perf tool through examples.
Prerequisites
- Access to the terminal.
- Access to root or a user with sudo privileges.
- A text editor, such as nano or Vi/Vim.
How to Install perf
The perf program does not come preinstalled on Linux systems. The installation differs based on the Linux distribution:
- Ubuntu/Debian
sudo apt install linux-tools-$(uname -r) linux-tools-generic- RHEL/CentOS
sudo yum install perf- Fedora
sudo dnf install perfVerify the installation with:
perf --version
The output prints the version number, indicating the installation was successful.
Allow Regular Users to Use perf
The perf command, by default, requires sudo privileges. To allow regular users to use perf, do the following:
1. Switch to the root user:
sudo su -2. Enter the following command:
echo 0 > /proc/sys/kernel/perf_event_paranoidThe command permits regular users to use the perf utility in the current session.
3. Switch back to the regular user with:
exit
To persist the changes, do the following:
1. Edit the sysctl config file:
sudo nano /etc/sysctl.conf2. Add the following to the file:
kernel.perf_event_paranoid = 03. Save the changes and exit nano.
Linux perf Command Syntax
The perf command syntax is:
perf <options> subcommand <options/arguments>The perf tool works like git. It acts as an interface for various subcommands and different activities. Running the command without any options or arguments shows the list of available subcommands.
Linux perf Subcommands
Below is a table outlining commonly used perf subcommands:
| Subcommand | Description |
|---|---|
annotate | Reads perf.data and shows annotated code. |
list | Lists all measurable events. |
| stat | Gathers performance statistics. |
record | Records samples into perf.data. |
report | Reads perf.data and displays the profile. |
script | Reads perf.data and displays trace output. |
top | Profiling tool. |
Subcommands have additional options. To display options for individual subcommands, run:
perf <subcommand> -h
The output displays a brief help window for the specific subcommand.
Linux perf Command Examples
To test the perf command, we're using phoenixNAP's s0.d1 small BMC instance running Ubuntu 18.04.
Note: For other use cases of the small BMC instance, check out some of our guides:
When profiling a CPU with the perf command, the typical workflow is to use:
1. perf list to find events.
2. perf stat to count the events.
3. perf record to write events to a file.
4. perf report to browse the recorded file.
5. perf script to dump events after processing.
The outputs differ based on the system and locally available resources.
1. List the Available Events
List all measurable events using perf with the list subcommand:
sudo perf list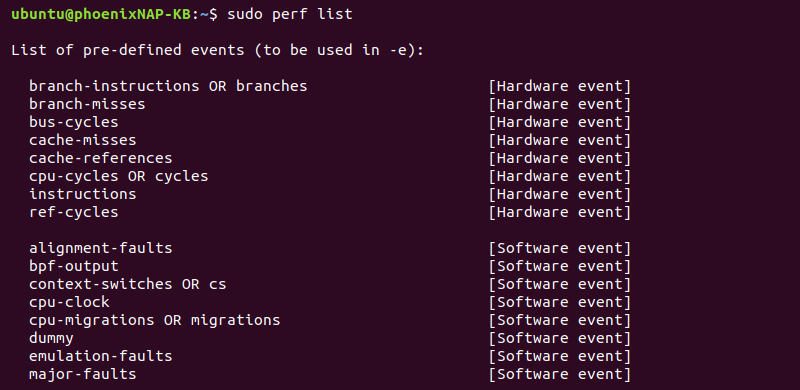
The output lists all supported events, regardless of type. Without sudo, the command shows a shorter list. When referencing events in other subcommands, use the -e tag followed by the event name from the first column.
Add the filter parameter after the command to limit the list by event name (first column) or event type (second column). For example, display only hardware events with:
sudo perf list hardwareOr alternatively:
sudo perf list hw
The output shows the filtered result based on the provided parameter or parameters.
2. View CPU Real-Time System Profile
To view the CPU profile in real-time, use the top subcommand:
sudo perf top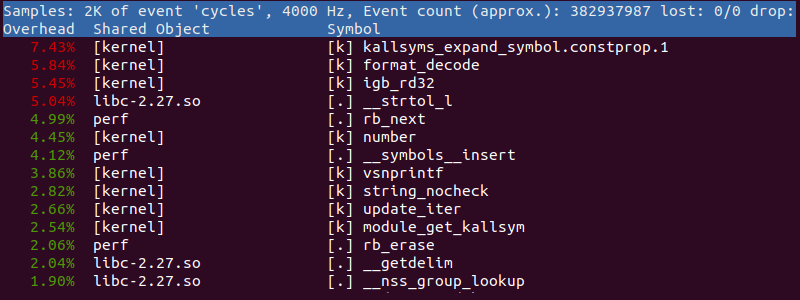
The command displays sampled functions in real time, similar to the Linux top command. The output prints the following three columns in order from left to right:
1. CPU usage tied to a function expressed in percentages.
2. The library or program that is using the function.
3. The symbol and function name, where [k] is kernel space and [.] is user space.
By default, perf top monitors all online CPUs. Additional options allow:
- Monitoring all CPUs (including idle) (
-a). - Monitoring specific CPUs (
-C). - Controlling the sampling frequency (
-F).
To display additional options during browsing mode, press h.
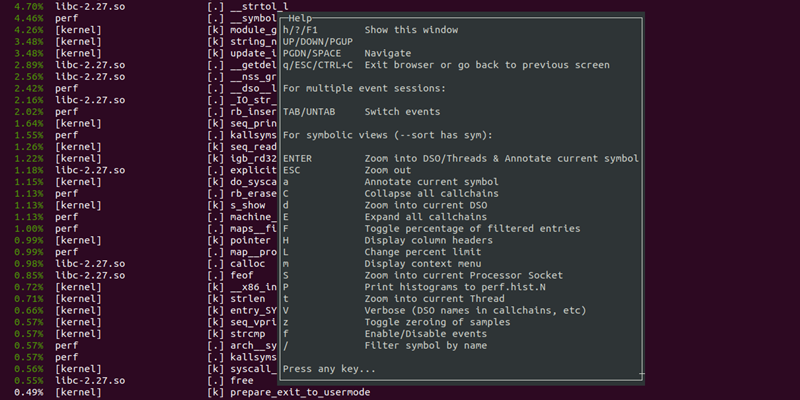
To exit the profiler and return to the terminal, press q.
3. View CPU Performance Statistics with perf
To display CPU performance statistics for all standard CPU-wide hardware and software events, run:
sudo perf stat -a sleep 5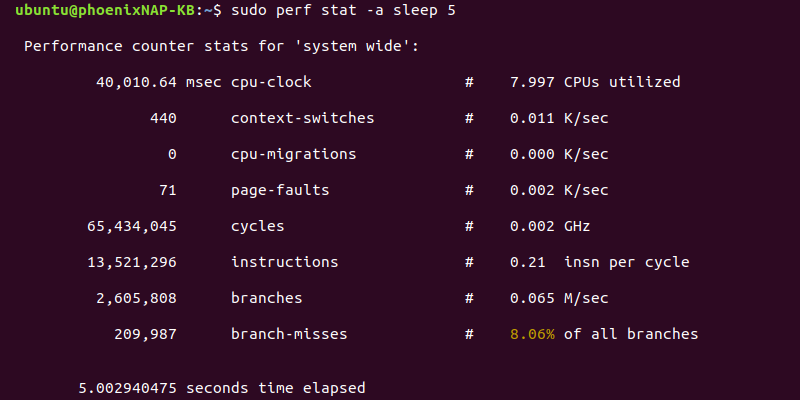
The output shows a detailed report for the entire system collected over five seconds. Without sleep 5, the system measures until termination with CTRL+C.
4. View CPU Performance for a Command
To check CPU performance statistics for a specific command, run:
sudo perf stat <command>For example, check for the ls command with:
sudo perf stat ls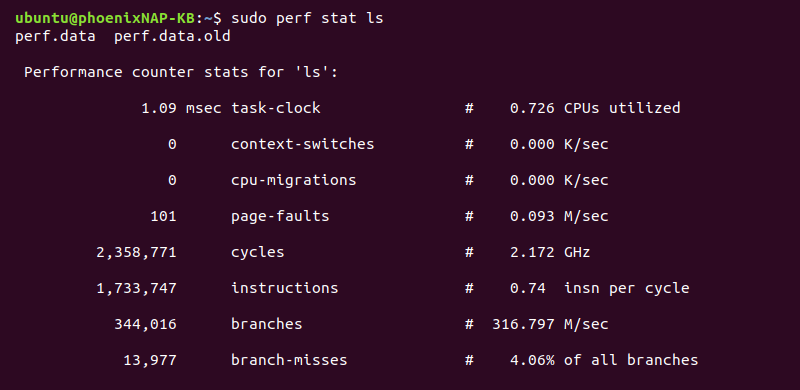
The total time a command takes shows as time elapsed at the end of the output.
5. View CPU Performance for a Process
Attach CPU performance statistics to a specific running process by using the -p tag and providing the process ID (PID):
sudo perf -p <PID> sleep 5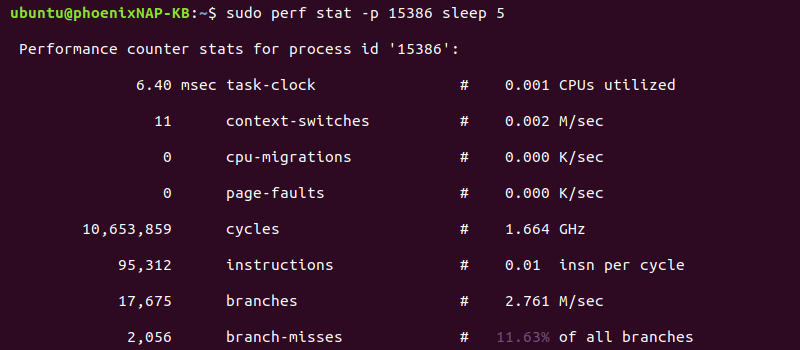
The output collects and displays performance statistics for the given process.
6. Count Event System Calls by Type
To count Linux kernel system calls by type, run:
sudo perf stat -e 'syscalls:sys_enter_*' -a sleep 5After five seconds, the output displays all system-wide calls and their count.
7. Record CPU Cycles
CPU cycles are a hardware event. To record CPU cycles, use the record subcommand and provide the event name with the -e tag:
sudo perf record -e cycles sleep 10
The recording saves the data into a perf.data file. The output prints the file's size and how many data samples it contains.
8. View Performance Results
To view the performance results from the perf.data file, run:
sudo perf report
The command helps read the perf.data file, displaying all the collected events and statistics. To exit the viewer, press CTRL+C.
9. Modify Sample Output Format
To view the sample output in standard output format, run:
sudo perf report --stdio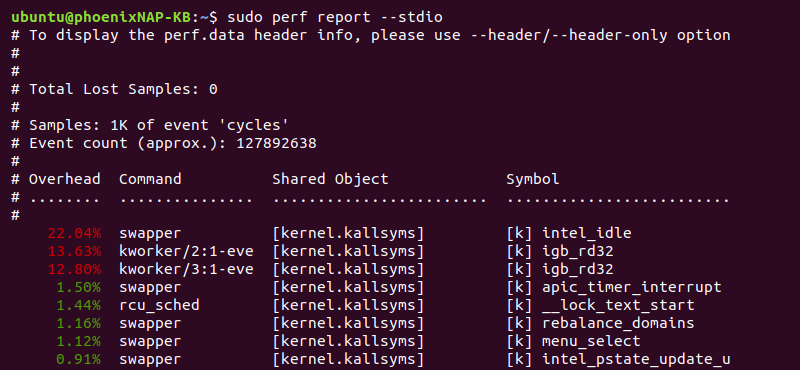
Additional modifications include displaying the sample number for each event (-n), and displaying specific columns (--sort <column name>). For example:
sudo perf report -n --sort comm,symbol --stdio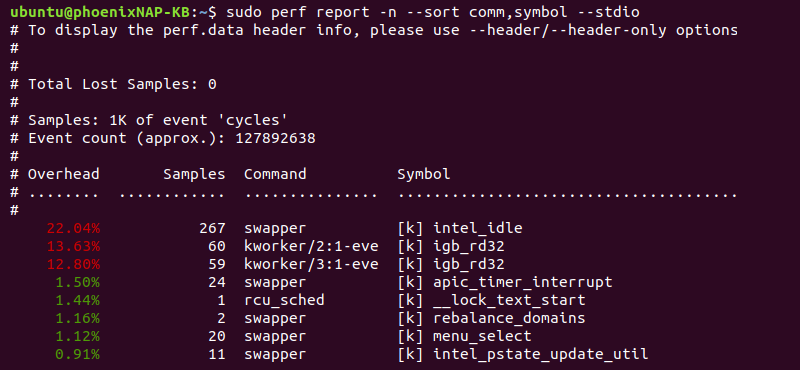
The output adds a column for the sample number and the command and symbol information.
10. Display Trace Output
Use the script subcommand to list all events from perf.data. For example:
sudo perf script
The output prints the perf.data details in time order. Use the script subcommand as post-processing data.
11. Display Trace Header
To display all the events from perf.data with additional trace header information, run:
sudo perf script --header
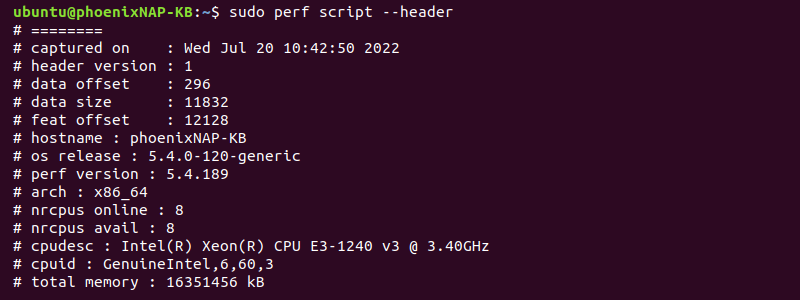
The output shows the file's header information, such as when the trace started, how long it lasted, CPU info, and the command that fetched the data. The events list is after the header information.
12. Dump Raw Data
To dump raw data as hex from the perf.data file, use the -D option:
sudo perf script -D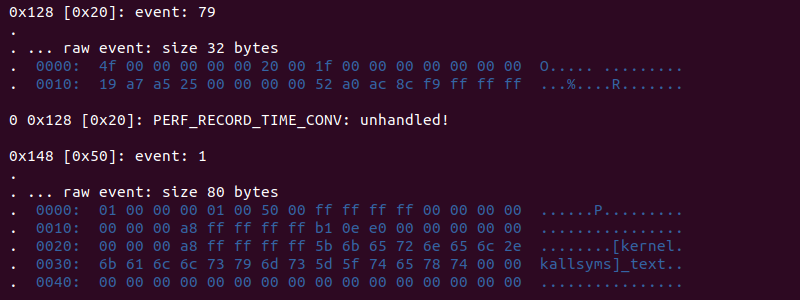
The result is the raw event trace information in ASCII format. The option is helpful for event debugging.
13. Annotate Data
To annotate data and further disassemble, use the annotate subcommand:
sudo perf annotate --stdio -v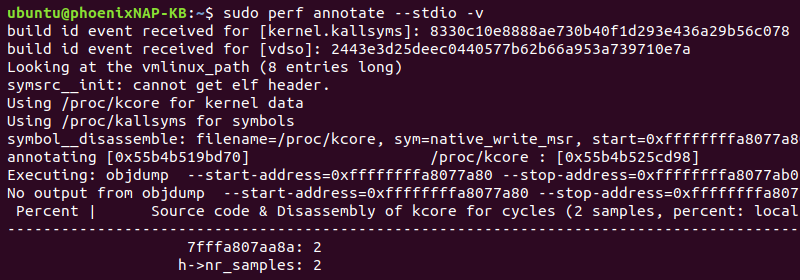
The -v option provides a detailed output. The result shows the source code and disassembly of the events.
Conclusion
After going through the examples in this guide, you know the basics of using the Linux perf command and some of the main subcommands. Use the man command to view the complete documentation of the performance analysis tool and the subcommands.


