Jenkins offers an open-source CI/CD automation solution for developers. One of the features Jenkins offers is automatically logging the performance of builds.
Reviewing Jenkins logs can offer a wealth of insight into how well your code works. This is particularly useful when identifying problems or looking for elements that can be better optimized.
In this tutorial, we will show you how to find, view, and edit Jenkins log files.

Prerequisites
- A copy of Jenkins installed and ready to use.
- Access to a web browser.
- Access to a text editor, such as Nano, Vim, or Notepad.
Note: Read our articles and learn how to install Jenkins on Ubuntu 18.04, Debian 10, CentOS 8, or Windows 10.
Where are Jenkins Logs Stored?
Where Jenkins logs are stored depends on the underlying operating system.
- Linux and macOS - Jenkins logs are stored along with other log files in the /var/log directory.
- Windows - Jenkins log files are stored in the Jenkins home folder, which is determined during installation.
It is possible to change the Jenkins log location by modifying its service configuration file. The name and location of that file depends on the underlying OS:
- Debian-based system - /etc/default/Jenkins
- Red Hat-based systems - /etc/sysconfig/Jenkins
- MacOS - org.jenkins-ci.plist
- Windows - [JENKINS HOME]/jenkins.xml
How to View Jenkins Logs?
To view a Jenkins log file, open it with a text editor of your choice. Below are the default locations of Jenkins log files depending on the operating system.
Jenkins UI
By default, Jenkins keeps a constant log of all activity as a part of the Jenkins dashboard.
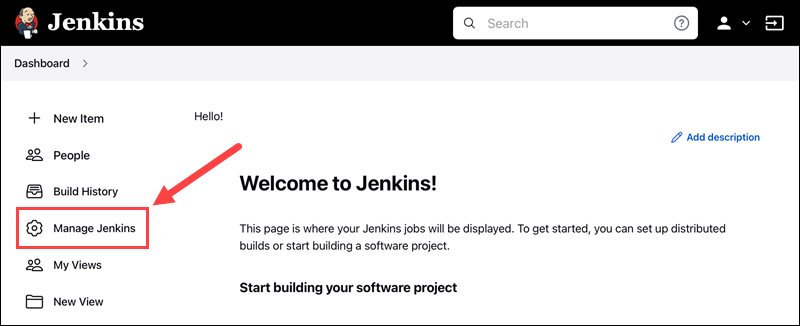
1. To access this log, click the Manage Jenkins link on the right-hand side of the dashboard.
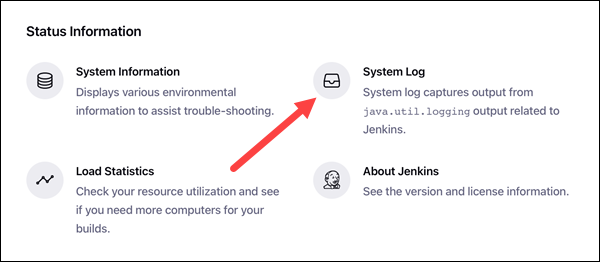
2. Click the System Log button in the Status Information section.
3. Click the All Jenkins Logs link to access the default log.

Each line of the log details the time and date of the action, the level of logging, the element of Jenkins performing the action, and the action being performed, followed by a brief description.
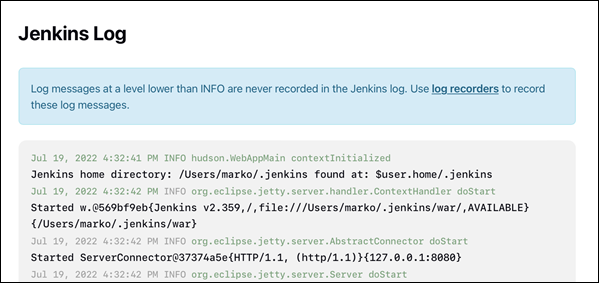
Note: Logs for individual project and pipeline builds are available in the build's Console Output section. Learn more about creating pipeline builds in our ultimate guide to Jenkins environmental variables.
Linux
The default location for Jenkins logs on Linux is /var/log/jenkins/jenkins.log. To view the log file, open it using a text editor such as Nano:
sudo nano /var/log/jenkins/jenkins.logWindows
On Windows, Jenkins log files are stored as jenkins.out (console output logs) and jenkins.err (error logs) in the Jenkins home folder.
Note: Jenkins logs may be stored in the Jenkins installation folder in Program Files on some Windows systems.
The location of the Jenkins home folder is specified during the installation. The default location is C:\ProgramData\Jenkins\.jenkins.
Important: The ProgramData folder is hidden by default. Make sure you enable viewing hidden items before trying to view Jenkins logs.
If you are not sure which folder you set as the Jenkins home folder, click the Manage Jenkins link on the left-hand side of the Jenkins dashboard.

Under the System Configuration section, click the Configure System button.
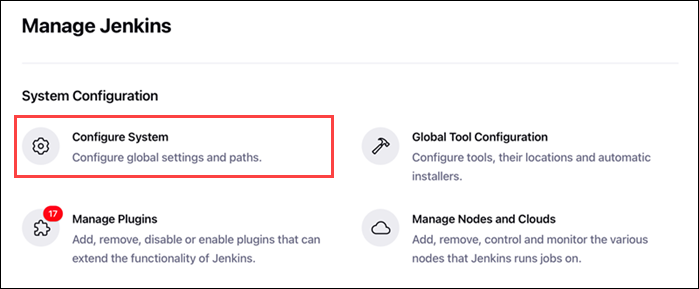
The location of the Jenkins home folder is listed at the top of the page, under Home directory.

MacOS
On MacOS, Jenkins logs are located at /var/log/jenkins/jenkins.log by default:
sudo nano /var/log/jenkins/jenkins.logDocker
Viewing Jenkins logs in Docker requires running Jenkins inside a detached container. Open Jenkins logs using the Docker logs command and the ID for the detached container:
docker logs [container ID]How to Enable Debug Logs in Jenkins?
Jenkins allows users to set up new log recorders when using the System Log page. These recorders collect and display information on specific elements of your code and you can fine-tune them to provide a more detailed output.
Having a more detailed log available makes it easier to spot and determine the cause of potential errors in the code. This is very helpful when debugging issues.
1. To set up a new log recorder, first click the Add new log recorder button in the Log Recorders section of the System Log page.

2. Next, enter the name of the new log recorder and click the OK button. For this example, we will name our log recorder Dig Debug.

3. To customize the output the new log recorder collects and displays, click the Add button to add a new logger. Use the input field to search for an element and select the log level from the drop-down menu. It is generally best to use the ALL or FINE logging level for debugging purposes.
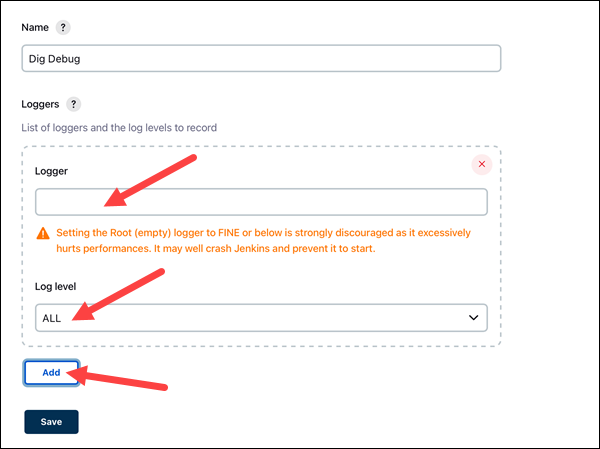
Note: Selecting the ALL or FINE logging level tends to produce substantial levels of output. To increase performance, consider removing the log recorder once you are finished with debugging.
4. For our example, we want to debug plugins related to Git. To do this, we will add new loggers monitoring these plugins and set the logging level to ALL.
5. Once you are done adding new loggers, click the Save button to save the new Jenkins log recorder.
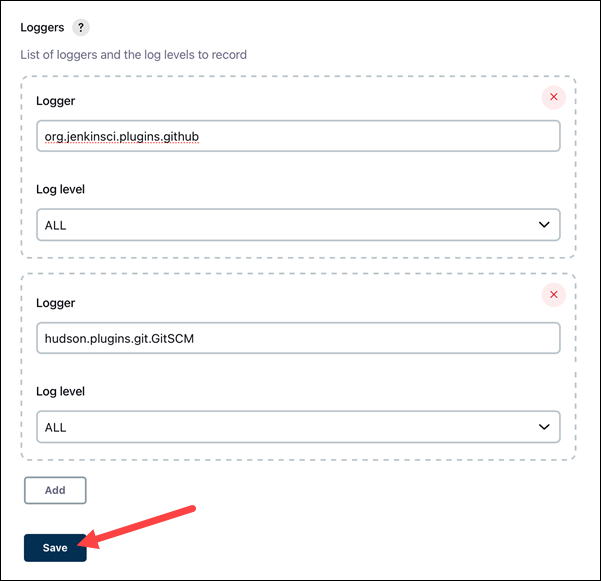
6. Once you've set up the new log recorder, open it by clicking its name in the Log Recorders section. With the log recorder open, click the Log records link on the left-hand side to review the new log records.

What Jenkins Logs Should You Monitor?
Certain events in the Jenkins log can indicate issues with the code or the Jenkins application itself. Monitoring these events is an easy way to diagnose and prevent performance issues quickly.
Receiving an OutOfMemoryError message indicates that Jenkins has run out of system memory. To resolve this issue, use a smaller Java heap or check for old saved data at:
[Jenkins URL]/administrativeMonitor/OldData/manageNote: The Jenkins URL is a combination of your system's hostname and the port number Jenkins is running on. For instance, when logging into Jenkins on the host system, the default Jenkins URL is http://localhost:8080/.
A java.lang.OutOfMemoryError: GC overhead limit exceeded error happens when the Java Garbage Collector exceeds its memory limit. A quick solution is to clear old builds that may be taking up memory.
Another common issue is CPU consumption, indicated by an OutOfMemoryError: PermGen space error. You can avoid this by minimizing the number of builds running on the master node, limiting build history, ensuring all Jenkins plugins are updated, and monitoring how other applications use the CPU.
How to Customize Jenkins Logs?
The formatting of Jenkins logs can sometimes make them difficult to read, especially when using higher logging levels. Long pipelines with dozens or hundreds of lines of code also present a challenge.
Below is an example log for a simple pipeline that prints out the build version number:
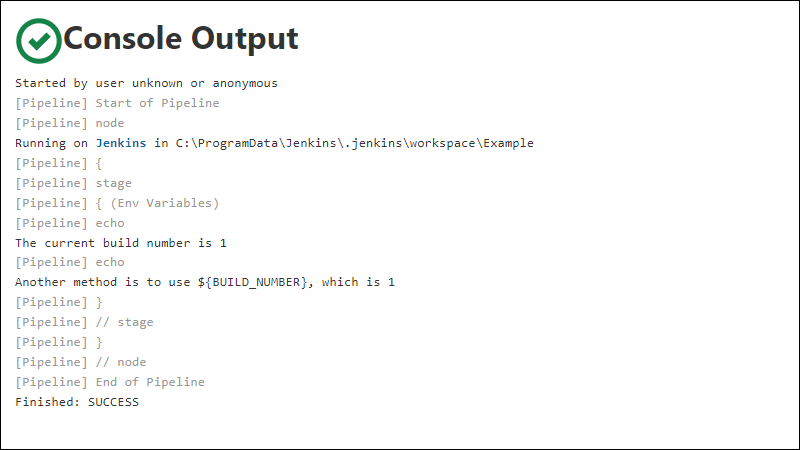
In the output above, it isn't easy to see where a stage starts and ends. The only indication is the stage output at the beginning and // stage at the end, both displayed in light gray.
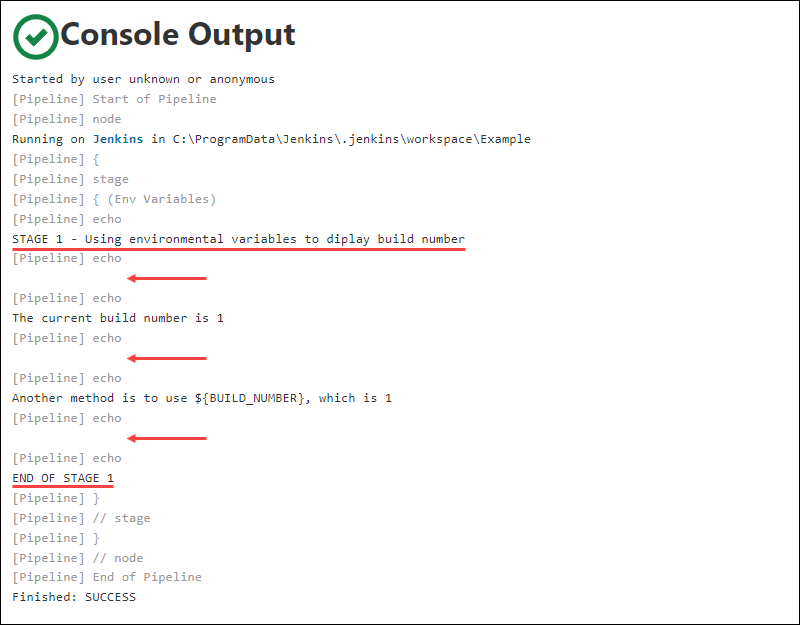
Adding a message with the echo command at the beginning of a stage makes separating different stages when looking at the console output easier. This also allows users to add brief descriptions, making it even easier to understand the output.
Another method is to add an echo command without any message text. This creates a blank line and makes the output easier to read.
Conclusion
After reading this tutorial, you should be able to find and view Jenkins logs and use them to diagnose potential issues with your project build.
