Most computer systems and applications keep logs that record what happens while they are running. You've likely used these logs to figure out why something happened or troubleshoot errors.
The information in an audit log is similar to regular log data. What sets it apart is how the data is organized, what details are included, and how the records are stored and used later.
Learn what audit logging is and why it matters, especially in automated and distributed systems.
What Is Audit Logging?
Certain system and user activity is so important that it needs to be recorded and stored so it can be reviewed later.
Audit logging is the process of collecting and storing these events. If something goes wrong, like an error or security incident, you can examine these records to get a clear picture of how one event led to another.
Audit logs help you find out who did what, when it happened, where it took place, and how it was done.
If your organization handles sensitive information and needs to meet security and compliance requirements, it is essential to keep reliable long-term audit logs.
How Does Audit Logging Work?
In real-life situations, audit logging often involves records from several different systems.
To fully understand what happened, organizations usually need to piece information together from events logged by these systems. For example:
- Applications log what users do.
- Databases track queries and any changes made by administrators.
- Operating systems log when users sign in and when their privileges change.
- Identity providers keep track of authentication events.
- Firewalls record details about network connections.
- Cloud or Bare Metal Cloud platforms keep logs of API use and account activity.
These records can be stored locally so you can review them later, but organizations often forward important events to a central logging or security platform, like Elastic or Splunk.
Centralized platforms gather these different logs, organize them into usable fields, and store them so that security and operations teams can search across everything in one place.
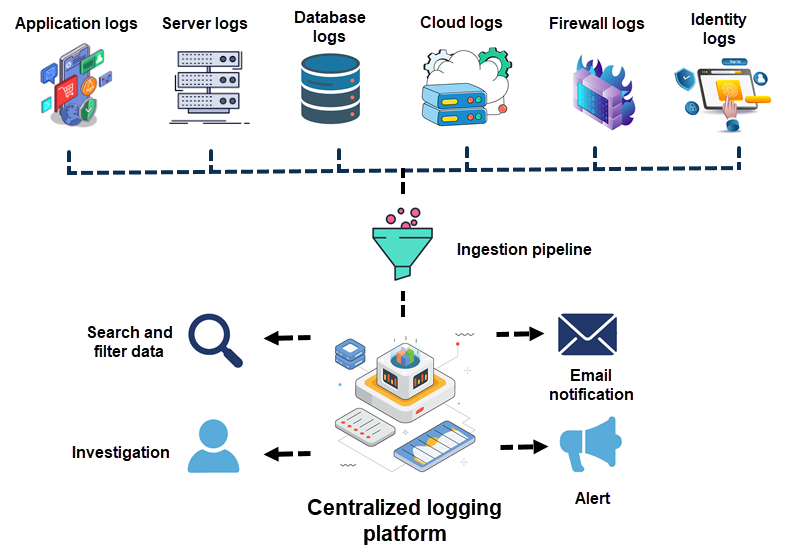
For instance, if a server shuts down without warning, an investigator might need to check several different logs:
| Firewall log | 09:34:28 | Server traffic stopped |
| Terraform log | 09:34:21 | Power-off server action started |
| Identity log | 09:33:57 | boss@coolcompany.com was authenticated |
| BMC audit log | 09:34:25 | Server powered off |
Each of these logs only shows part of what happened. In a centralized platform, the investigator can match up the timestamps, put the events in order, and reconstruct the sequence much faster.
Audit Logs vs. System Logs vs. Application Event Logs
The main difference between these three types of logs is how the recorded information is used and for what purpose:
| Audit Log | System Log | Application Event Log | |
|---|---|---|---|
| Purpose | Keeps a traceable record of important actions by users, administrators, and the system. | Shows what is happening on an operating system or infrastructure resource. | Records events that come from a specific app or service. |
| Used By | - Security teams - Auditors - Compliance teams - Investigators | - System admins - Operations teams - Infrastructure engineers | - Developers - App admins - DevOps teams - Support teams |
| What They Capture | - Logins - Permission updates - Configuration changes - Administrator actions | - Startup events - OS errors - Hardware problems - Network activity - Service failures | - Application errors - Warnings - Requests - Processing events |
| Log Volume | The amount of data is usually lower because only certain actions and events are logged. | These logs can generate a lot of data, especially on busy servers and infrastructure systems. | The log volume can be low or very high, depending on how active the application is and the logging level set. |
| Retention | Often kept for a long time due to compliance and security. | Usually retained as long as needed for operations and troubleshooting. | Depends on the application and the logging platform. |
Note: If you're also looking for tools to collect and manage system logs, check out our guide to the best Syslog servers for Linux and Windows.
Audit Log Event Data and Structure
Applications and services can use a lot of different log formats and field names. Here, we use the phoenixNAP BMC audit event schema as an example. Below is a sample log event written in plain text:
boss@coolcompany.com used the deploy-bmc-script to power off a server at 09:34:21People can read and understand this sentence, but logging software usually needs a more structured entry so it can identify the user, application, and timestamp faster.
JSON
Audit logs are easier to process when information is stored in clearly defined fields. JSON is a popular format for organizing data into fields and values. Here is the same BMC example written in JSON:
{
  "name": "Server powered off",
  "timestamp": "2026-10-07T09:34:21Z",
  "userInfo": {
    "accountId": "bmc-account-59872",
    "clientId": "deploy-bmc-script",
    "username": "boss@coolcompany.com"
  }
}
This is what the fields mean:
name. Explains what happened. The event name confirms that the server was powered off.username. Identifies the user that performed the action.timestamp. Shows when the event was recorded in the audit log.accountId. Shows which account the event happened under. When a logging platform tracks activity for several accounts or organizations, this field makes it easier to link the event to the right environment.clientId. Identifies the application that made or started the request. This type of field is especially useful in automated environments, where lots of requests come through scripts or APIs.
Other logging systems may include additional fields like session_id, ip_address, or resource_id:
session_id. Shows which authenticated session was active when an action took place. You can use it to group all the different events that happened during the same session.ip_address. Some systems track the IP address a request comes from. But it's sometimes hard to link an IP to a specific person or physical computer. This is especially true on VPNs and shared networks, where several users or systems often appear under the same address.resource_id. Some logging systems include a resource identifier that shows which resource was affected. The resource could be a server, user account, or any other object the platform manages.
Key-Value Pairs
Here is the same event from before, this time logged using key-value pairs:
name="Server powered off" timestamp="2026-10-07T09:34:21Z" accountId="bmc-account-59872" clientId="deploy-bmc-server" username="boss@coolcompany.com"The key tells you what the information means, and the value contains the actual data.
In this case, clientId is the key and deploy-bmc-script is the value. Key-value pairs, like those in JSON, help software identify and search specific pieces of log data more easily.
Common Event Format
The Common Event Format (CEF) is used to normalize and exchange security event information between different software tools and platforms. Organizations often use it when they need to collect security and audit logs from several apps in one place.
For example, you can set up a logging pipeline that converts the BMC power-off event into a CEF-style record:
CEF:0|phoenixNAP|BMC|1.0|100|Server powered off|5|suser=boss@coolcompany.com cs1=deploy-bmc-script cs1Label=clientIdAs you can see, this is no longer the native BMC audit format. The same event was converted to fit CEF before being passed to a centralized logging platform.
Platforms like Elastic can process CEF records, read their fields, and map them into a common schema. This makes it easier to search and analyze these logs along with logs from other sources.
Audit Logging Terminology
The following terms and concepts are key to understanding how audit logs work.
Immutability
Audit logs must not be changed after they are written. This is called immutability. For example, the original event in the previous example states that a server has been turned off:
"name": "Server powered off"If the log were not immutable, someone could change the record later to:
"name": "Server viewed"If this happens, the audit trail would no longer show what really happened, making the entire record useless. Immutable logs preserve the original event and can be trusted during a review or investigation.
Note: Immutability isn't used only in audit logging. For example, using immutable backups can help protect your data from ransomware.
Write-Once-Read-Many (WORM) Storage
WORM storage, which stands for write-once-read-many, is a reliable way to protect audit records and support log immutability.
With WORM storage, data is written only once but can be read as many times as needed.
For example, you can export BMC audit records to WORM storage and keep them for a year. Admins and auditors can review the record that shows the server was powered off, but they cannot change the original copy.
Note: In addition to WORM storage, you can use several other methods to protect logs and sensitive data. Explore database security practices that keep your information safe and available.
Non-Repudiation
Non-repudiation means there is enough evidence so no one can credibly deny that a recorded action took place. In the BMC example, the log shows the server was powered off by a specific user and application:
"username": "boss@coolcompany.com",
"accountId": "bmc-account-59872",
"clientId": "deploy-bmc-script"
This does not prove that the person with the boss@coolcompany.com username actually performed the action, but it does show the username was used. To prove who did it, you would need additional security steps; however, the user cannot deny their account was used.
Cryptographic Hashing
A cryptographic hash is a unique value calculated from the log event record. For example:
Event:
Server powered off
Hash:
6h8ggc4...
Even a small change to the record will produce a different hash value. By comparing these values, you can see if the record has been tampered with.
This is another way, besides WORM, digital signatures, and other controls, to ensure your log records cannot be tampered with.
Chronological Sequence
It is not enough to just record the event or the time it happened. Events need to be stored in the order they happened to show how they unfolded. For example, the BMC power-off event might be a part of a sequence:
| 09:33:57 | boss@coolcompany.com authenticated |
| 09:34:21 | Terraform submits a power-off request |
| 09:34:25 | Server powered off |
During an investigation, this makes it easier to see what happened before the server was powered off, what triggered the change, and what happened after.
NTP Alignment
Over time, clocks on different devices can slowly drift apart. When this happens, related events may show up in the wrong order, making it much harder to figure out what actually happened.
Hypothetically, if the timestamps do not match, it could seem like a power-off request was received before it was actually sent.
Note: NTP is just one of many network communication protocols. If you want to learn more about other protocols that devices use to connect and share information, check out our complete guide to network protocols.
The Network Time Protocol, or NTP, solves this problem by syncing system clocks with trusted time sources over a network. When clocks are in sync, the order of events is much clearer, and timestamps stay consistent across all systems.
Why Audit Logging Matters for Compliance, Governance, and Security Forensics
Organizations that handle sensitive information, such as payment details or healthcare records, need to prove they can monitor access and maintain records of important activities.
Audit logs play a key role in security and compliance. They are used as evidence in internal investigations, external audits, insurance claims, and legal cases.
Regulatory Frameworks and Audit Retention Requirements
The most important frameworks that affect audit logging and retention include:
PCI-DSS
Companies that store, process, or transmit payment card information must comply with the Payment Card Industry Data Security Standard (PCI DSS).
Audit logging is an important part of PCI DSS because companies need to keep a record of activity involving cardholder data and the systems that process it. For example, if an employee views payment information or an administrator changes a security setting in a payment-processing system, these actions should be logged for later review.
Note: If you work with payment card data, check out our 12-step PCI DSS compliance checklist for practical steps to become and stay compliant.
Organizations also need to continuously monitor logs for suspicious activity and keep them available for audits and security investigations.
GDPR
The General Data Protection Regulation (GDPR) is a European Union law that governs how organizations handle and protect personal data.
Audit logs help organizations follow GDPR rules by keeping a record of who accessed personal data and what they did with it.
Note: Understanding privacy laws in different regions can be tough, especially for online business owners. Our CCPA vs. GDPR guide explains the key differences between these two US and EU privacy laws.
For example, if an employee views, changes, exports, or deletes a customer's personal information, these actions are recorded. This gives the organization a traceable history of what happened. These records can then be used during internal reviews, data breach investigations, and regulatory audits.
Audit logs also support the GDPR principle of accountability by giving organizations evidence that they handled personal data according to established policies and access controls.
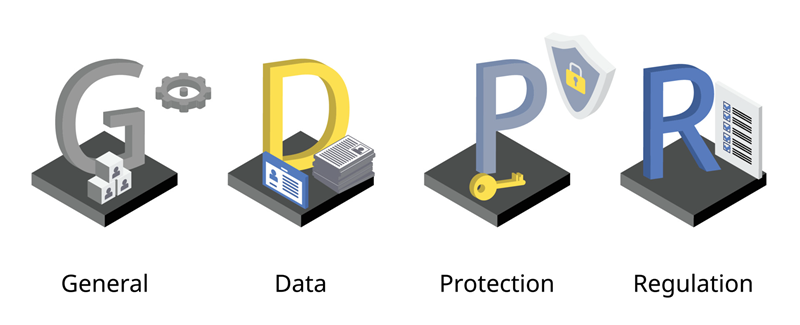
At the same time, audit logs can contain personal data themselves. This means you also need to protect your audit logs, control who can access them, and avoid storing more personal data than necessary to stay in line with GDPR requirements.
SOC 2
SOC 2 is a framework for evaluating how organizations protect customer data and manage their systems. SaaS companies, data centers, and hosting providers often use it even though it is not required by law. However, customers and business partners often ask for it as proof that a company has strong security and data protection controls.
Note: If you are working toward SOC 2 compliance and certification, our short guide will help you get started and walk you through the steps.
Audit logs help provide that proof. They show who accessed a system, what administrators changed, and when key activities took place. During an SOC 2 audit, these records show that controls like access management and incident response are working as intended.
HIPAA
HIPAA is a US federal law that protects the privacy and security of protected health information (PHI). Audit logging helps organizations follow HIPAA rules by tracking who accesses systems that store or use PHI.
For example, if your employee views or updates a patient's medical record, you need to record that activity so it can be reviewed later if needed.
Note: The OCR sets different fines and penalties for HIPAA violations depending on how serious they are. Read our guide to learn about the four categories of HIPAA violations.
For example, the Office for Civil Rights (OCR) at the Department of Health and Human Services often looks into organizations when they get a complaint, a breach report, or see signs of a possible HIPAA violation.
Your audit logs will be essential in these cases because they help investigators establish a clear chain of events and show who accessed protected health information and what actions they took.
Audit Logging Techniques
You can capture and analyze audit log events at different stages and in different ways before they reach your long-term storage.
Application-Level vs. Middleware-Level vs. Infrastructure-Level Logging
Some records are generated directly by an application, while others come from middleware, infrastructure services, or logging tools.
Application-level logging tracks what happens inside the application. This includes user logins, updates, and changes in permissions. For example:
{
  "timeStamp": "2026-10-07T09:33:57Z",
  "category": "AUDIT",
  "context": {
    "ip_address": "198.51.100.41",
    "principalId": "boss@coolcompany.com"
  },
  "details": {
    "type": "AUTHENTICATION",
    "resultText": "AUTH_SUCCESS",
    "message": "Login successful"
  }
}
In this example, we see that the boss@coolcompany.com user logged in successfully at 09:33:57.
Middleware-level logging records activity as requests move between applications and services. An API gateway or message broker logs the following request:
{
  "requestId": "7ghy9i2p-4i90-5ch6-a9lk-7sa7c8awuo88",
  "ip_address": "198.51.100.41",
  "requestTime": "07/Oct/2026:09:34:20 +0000",
  "httpMethod": "POST",
  "routeKey": "POST /servers/{id}/power-off",
  "status": "200",
  "protocol": "HTTP/1.1"
}
This record shows that a POST request was sent to the server power-off route and returned a successful HTTP response. Infrastructure-level logging captures events from servers, network operating systems, and cloud platforms.
This BMC audit record shows that the server was powered off:
{
  "name": "Server powered off",
  "timestamp": "2026-10-07T09:34:25Z",
  "userInfo":  {
    "accountId": "bmc-account-59872",
    "clientId": "deploy-bmc-script",
    "username": "boss@coolcompany.com"
  }
}
By combining these three records from different logging stages, you can trace the activity from the user login through the API request to the infrastructure change, instead of only seeing that the server was powered off.
Asynchronous Logging Patterns and Non-Blocking Buffering
Writing every audit log directly to storage can slow down an application, especially if there are lots of events.
Asynchronous logging can help you relieve some of this pressure by putting log records into a queue or buffer. The application can then continue working while another process handles writing the records to their destination. Here is a simple example of how this works:
1. An application creates a log event.
2. The log record is temporarily placed in a queue or buffer.
3. A logging service reads the record from the queue.
4. The logging service processes and standardizes the log data, then sends it to long-term storage.
This way, the application does not need to wait for the logging system to finish writing the record before it can continue.
When you use asynchronous logging, the biggest challenge is reliability. If any of the components in the chain, such as the application, queue, or logging service, fails before it stores the buffered event, the audit record would be lost.
Secure Log Transport: TLS and Mutual TLS (mTLS)
Audit records usually contain sensitive information, so it is important to keep them safe as they move between systems and the centralized logging platform.
TLS is often used because it encrypts the connection, making it hard for others to read the data in transit. Before sending any data, the system sending the logs must verify the identity of the receiving server.
To use TLS, you need to set up the receiving server with a certificate and a private key. The system sending the logs should be configured to trust and verify this certificate.
Note: The TLS and SSL protocols are very similar, and people often mix them up. Read our quick comparison of the two to clear up any confusion.
Mutual TLS, or mTLS, adds another layer of security by making both sides prove who they are. To use mTLS, both the sending and receiving systems need certificates so they can verify each other's identity.
In this setup, a log collector is sending audit records to a centralized logging server:
1. The log collector verifies that it is really connecting to the logging server.
2. The logging server also checks that the log collector is genuine.
3. Once both sides are verified, they set up an encrypted connection.
4. The audit records are then sent over this secure connection.
Using mTLS makes it much less likely that audit logs will be intercepted, tampered with, or sent to an unauthorized destination.
Step-by-Step Audit Logging Process
Before you start recording events, you need to decide which activities matter and what happens to those records after they are created.
Step 1: Defining Scope and Audit Policy Requirements
Applications and systems generate thousands of events, but many of them have little value for compliance or security. You probably do not need to log when someone creates a new folder or document. However, if someone changes permissions on that folder or deletes sensitive data, it may be important enough to record.
Ask yourself: Which systems, users, and actions does your organization need to audit, and why?
For instance, a company using Bare Metal Cloud may want to track:
- API authentication requests.
- When a server is created or powered off.
- User logins or if user permissions change.
- When the network configuration changes.
Your audit policy should also define what happens after these events occur. Some actions are just recorded for future review, but more sensitive activities should trigger an immediate alert.
For example, viewing information about a server can be logged. But deleting an SSH key or changing user permissions should set off a security alert.
Note: If you need help setting up key-based authentication, we have step-by-step guides for both Ubuntu and Windows.
The policy should also define who can view and manage the audit logs. For example:
- Security staff can search or review audit records.
- Admins usually need access to manage the logging platform.
- Auditors are often given read-only access.
- Most regular users should not be able to modify or delete audit records.
Setting these rules early will help you avoid collecting unnecessary data and ensure that important activity is available when you need to investigate an incident.
Step 2: Designing Standardized Audit Event Schema
Once you know which events to record, you need to decide what information each record should contain.
Using a standard schema gives your records a consistent structure. This is an example of a record showing that a user's permissions were changed:
{
  "timestamp": "2026-10-07T09:41:08Z",
  "resourceId": "user-582",
  "action": "change_permissions",
  "result": "success",
  "username": "boss@coolcompany.com"
}
Different apps and services often use different names for these fields. For instance, one system might use user=boss@coolcompany.com, while another uses username=boss@coolcompany.com. A logging pipeline can map both fields into the same standardized format.
This process is called normalization. It makes records from different sources more consistent, so it's easier to search and compare them in a centralized log.
Once the records are normalized, you can search the audit logs for:
- All actions performed by
boss@coolcompany.com. - All admin actions that failed.
- Everything that happened to
user-582from 09:30 to 10:00.
The result will include all the relevant records from different sources, even if the original records had different field names or formats when they were created. A standardized schema also makes it easier to add new log sources, because you already know which information the logging system expects from each record.
Step 3: Implementing Secure Log Ingestion and Delivery
You need a way to send audit events from their source to the logging platform. Each component of the logging pipeline handles different parts of this process:
1. An application or script creates an audit event.
2. A logging agent or collector gathers records from one or more sources.
3. The records are then securely forwarded to the ingestion pipeline. Encryption keeps them safe while they are in transit, and authentication verifies the systems sending and receiving the logs.
4. The ingestion pipeline parses the records, extracts useful fields, and can normalize them into a standard format.
5. The logging platform receives the processed records, stores them, and makes them available for search and analysis.
You also need to build resilience into your pipeline so it can handle temporary failures or high event volumes without losing important records. If the central logging service is down for a few minutes, you can set up a queue or local buffer to hold events until they can be delivered.
Step 4: Storage Hardening, Encryption-at-Rest, and Immutability
Once the audit records reach storage, you need to protect them for as long as your retention policy requires. The retention period depends on your business needs and compliance requirements.
A basic storage lifecycle might look like this:
1. An audit record is written to storage.
2. The stored data is then encrypted.
3. Access to the data and any changes are limited to authorized users.
4. The record remains in storage for the required period.
5. When you no longer need the record, delete it securely.
You can use some or all of the following methods to protect stored audit data:
- Encryption at rest protects log data while it is stored in databases or on disks.
- Role-based access controls restrict who can view or manage these records.
- WORM storage adds extra protection by making sure records cannot be changed after they are written.
- Backups and replication make sure your logs are available for as long as you need them, even if there is a major failure or data loss.
If you use a centralized logging platform, many of these controls are already built in. However, you still need to set them up to match your organization's security and retention needs.
You also need to review the logging platform itself from time to time. For example, if an administrator changes a retention policy or tries to delete an audit record, that action may need to be logged as its own audit event.
Step 5: Continuous Monitoring, Automated Alerting, and Log Auditing
One of the main reasons for collecting audit logs in centralized platforms is to monitor the system and react when you notice unusual activity.
Monitoring tools can analyze audit events and look for unusual behavior patterns. If something suspicious happens, they alert the security or operations team to take a closer look. For example:
| 09:40:12 | Failed admin login |
| 09:40:24 | Failed admin login |
| 09:40:32 | Failed admin login |
| 09:40:48 | Successful admin login |
| 09:41:12 | User permissions changed |
A single failed login may not mean much. But if there are several failed attempts followed by a successful login and then an admin change, it's a sign you should investigate.
Security and operations teams can check related records from other systems and compare the timestamps, IP addresses, and user accounts to understand what happened.
You should regularly review the audit logging process itself to confirm that:
- All the retention and access rules are being followed.
- The system is capturing all the required events.
- Timestamps and other fields are being recorded correctly.
- Logs continue to reach the centralized logging platform as expected.
- Stored long-term records are still available for later review.
This way, you can be confident that your audit process works as intended, instead of running into a logging issue during an incident.
Audit Logging and Infrastructure as Code (IaC) and DevOps Workflows
Infrastructure as Code and DevOps workflows automate a lot of infrastructure management tasks that used to be done manually. As a result, deployments are much faster and more consistent. But it also means organizations need a clear record of what changed and who initiated the change.
An automated deployment usually involves several systems. For example:
- A developer updates the infrastructure configuration and commits the changes to Git.
- The CI/CD pipeline detects the change and starts the deployment workflow.
- Terraform reads the new configuration and sends the necessary requests to the infrastructure platform.
- The infrastructure platform makes the change and logs the API activity.
Note: If you're new to version control systems, find out how to install Git on Ubuntu and learn the basics in our Git Tutorial for Beginners.
Each stage produces its own log records. Audit logging lets teams compare these records and track a change from the original configuration all the way to the running infrastructure.
Codifying Audit Logging with IaC (Terraform, Ansible, and Cloud-Init)
Instead of setting up logging manually each time you launch a new server, you can build logging into the deployment process itself.
Different IaC tools can help with each part of the setup. This is an example of an automated deployment flow using Terraform and Ansible:
1. Terraform creates the server and required network resources for the logging environment.
2. cloud-init applies the initial configuration and installs a log collector when the new server first starts up.
3. Ansible configures the log collector with the address of the centralized logging platform.
Note: If you're not sure whether free Ansible can support your workloads, read our Free vs. Paid Ansible comparison to find out if you need the extra features.
4. Credentials, certificates, and other authentication settings are applied.
5. The logging service starts up and begins forwarding events.
6. The CI/CD pipeline checks that the collector is running and that the logging destination can be reached.
7. A test event is sent to check if the logging platform receives the record.
If any of these checks fail, the pipeline can report the problem or stop the deployment. Logging is now part of the server deployment instead of something that needs to be added later.
You can use the same approach to deploy infrastructure behind the logging platform. Terraform can create collector, processing, or storage servers and the networks that connect them. Ansible can then configure the software running on those systems.
If you ever need to rebuild a server or add another collector, you can just reuse the same configuration instead of starting from scratch.
Audit Logging on phoenixNAP Bare Metal Cloud
If many services and apps send records to a single platform, your audit logging system might become strapped for resources. You may need extra CPU, memory, storage I/O, or network capacity to keep up with the workload.
phoenixNAP Bare Metal Cloud (BMC) provides dedicated infrastructure for these workloads and gives you the automation tools you need to build and manage a modern logging pipeline.
Dedicated Resources for High-Volume Audit Logging
A logging platform handles several operations at the same time. It receives and parses new events, writes them to storage, runs queries and reports, and sends alerts when needed.
This can be a problem if log volumes suddenly increase.
For example, during a DDoS attack, a logging platform might need to handle a sudden spike in events, jumping from 2,000 to 20,000 events per second. At the same time, the security response team is searching and updating stored records to find out more about the attack.
On shared infrastructure, workloads from other tenants may also be competing for the same physical resources. This is called the noisy neighbor effect.
This can reduce the compute, memory, storage, and network resources available to your logging platform when you need them the most.
With bare metal infrastructure, you do not have to share the physical server with anyone else. You get dedicated resources and more control over how the environment is sized for expected log volumes and traffic spikes.
Using NVMe Storage for Ingestion, Indexing, and Search
In audit logging, the same data is often written, indexed, and searched many times over. A typical event goes through several operations that depend on storage performance:
1. The event reaches the logging platform.
2. The record is written to storage.
3. The fields in the record are then parsed and processed.
4. Search indexes are updated.
5. The updated index data is stored.
6. Later, the record can be searched or analyzed.
When a lot of events go through this process, storage I/O plays a major role in how well the logging pipeline performs.
Local NVMe storage is well suited to components that need to read and write data frequently, such as:
- Ingestion services.
- Search indexes.
- Logging databases.
- Processing nodes.
phoenixNAP BMC servers come with local NVMe storage designed for heavy I/O workloads. This makes them a solid choice for logging components that need to write, index, and retrieve lots of audit records quickly.
If you need more capacity, you can connect BMC instances to phoenixNAP Network File Storage or other storage services. This option allows you to separate ingestion and processing from long-term retention.
Older records are searched less often than actively processed data. This means you can use faster storage, such as NVMe, for ingestion and searching, and larger, slower storage for retention.
Using phoenixNAP Bare Metal Cloud to Run a Logging Pipeline
A centralized logging platform does not have to run on a single server. Different BMC servers can handle different parts of the pipeline.
For example, phoenixNAP Bare Metal Cloud servers can host different components, such as:
- Log collectors.
- Ingestion and processing services.
- Databases.
- Search engines.
- Storage systems.
In a basic setup, one server might collect incoming records, another could process and index them, and a third could handle storage or search workloads.
You can assign resources according to each server's role and expand individual parts of the logging environment as needed.
phoenixNAP BMC also has its own Audit Log API that records account and API activity. This includes server power operations, billing changes, and SSH key deletions.
You can collect these BMC audit events alongside other logging data, adding another source of information to your application and infrastructure logs.
Direct Hardware-Level Security Control and Workload Isolation
Audit log records include usernames, IP addresses, and other sensitive details. This is why it's so important to manage who can access the logging environment and how the system is configured.
Using a single-tenant bare metal server can give you more control over the operating system, storage setup, network settings, and access controls used to protect audit data.
Because the physical server is not shared with other tenants, it also provides stronger isolation for your workloads. For example, your organization might need to:
- Encrypt stored audit records.
- Make sure only authorized people can change records.
- Retain records for a strictly defined period.
- Be able to export records if there is an investigation.
With the level of control phoenixNAP BMC offers, you can handle all these tasks and design your own logging environment based on your organization's security, retention, and forensic needs.
Best Practices for Maintaining Audit Log Integrity and Compliance
Use these best practices to keep your audit records accurate and secure:
- Only allow authorized users, admins, and services to view, manage, or delete audit records.
- Use encryption to protect audit log records while they are in transit as well as in long-term storage.
- Once stored, audit records should not be changed. Use methods like WORM storage to ensure they cannot be modified after they are written.
- Make sure all systems sending logs use the same time. This keeps timestamps consistent and helps you track events accurately. Use NTP or another method to keep system clocks in sync.
- Before storing logs long term, remove or mask API keys, tokens, PII, and other sensitive data. Storing this information in logs can cause serious security and regulatory issues.
- Normalize logs during ingestion and use standard field names and structured formats where possible. This makes records easier to search, compare, and process automatically.
- Logging and retention rules can change over time. Check your policies from time to time to make sure they match current standards, regulations, and contracts.
- Set up automated alerts for different events to help your security and support teams respond faster. For example, create alerts for gaps in log delivery, unexpected changes, suspicious activity, and any attempts to turn off or get around logging.
- Keep secure backup copies of important audit records. This way, your logs will still be available in case something gets accidentally deleted or hardware fails.
Top 5 Software Solutions for Audit Logging
Modern audit logging solutions usually provide a complete platform that can store, search, monitor, and visualize audit data. Here are five popular tools you can use to build an audit logging system.
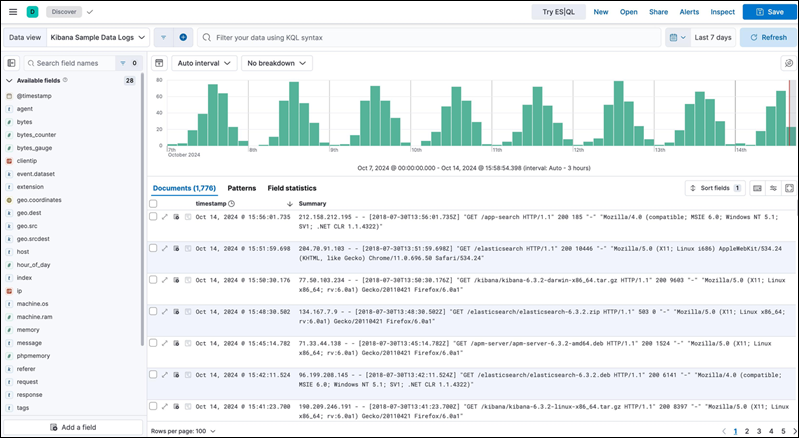
Elastic Stack (ELK - Elasticsearch, Logstash, Kibana)
The Elastic Stack combines several tools to build a single platform for audit logging platform.
- Logstash gathers and processes data as it comes in.
- Elasticsearch stores the data and makes it searchable.
- Kibana offers tools to query and visualize the results.
Elastic supports audit logging in both Elasticsearch and Kibana. These logs can record events such as authentication attempts, data access, and changes to security settings.
Benefits
Elastic is flexible and can process large volumes of audit records that come from many different applications and infrastructure components.
It supports structured data and has excellent search capabilities within its dashboards. You can run the stack on your own system, which gives you more control over where the audit data is stored.
Drawbacks
Elastic can be harder to set up and maintain compared to fully managed logging services. Large self-managed environments need careful planning for storage, indexing, cluster resources, retention, and upgrades.
Also, some of Elastic’s security audit logging features are only available with certain subscription levels.
Cost/Pricing
Elastic has a free self-managed tier that includes the core Elastic Stack and some security features. Paid self-managed subscriptions add more enterprise features. You would need to contact Elastic's sales department for pricing details.
Datadog Audit Trail
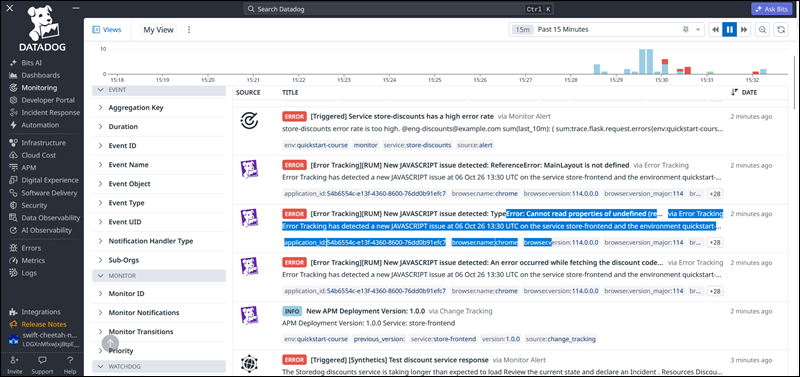
Datadog Audit Trail keeps track of both administrative and user actions on the platform. It shows who did what, what was changed, and details about each event.
Right now, Datadog logs over 100 types of audit events. These include authentication activity and changes to monitors, dashboards, API keys, roles, logging settings, and other resources.
Benefits
Audit Trail is part of Datadog, so it’s easy to use if you're already on the platform. You can filter and investigate events with Audit Explorer, compare them to earlier settings, and analyze them with other Datadog security tools.
You can also save audit records to Amazon S3, Google Cloud Storage, or Azure Storage.
Drawbacks
Datadog Audit Trail focuses on tracking activity within the Datadog platform. It's not a replacement for a general-purpose audit logging system that collects events from all your applications and infrastructure.
If you want to use it as part of a broader logging setup, you may need other Datadog logging and security products.
Cost/Pricing
Datadog charges for Audit Trail as a percentage of your total Datadog spending. The current published rates are 2% or 3%, depending on your plan. Extra costs may apply for data retention and other Datadog logging services.
Graylog Enterprise
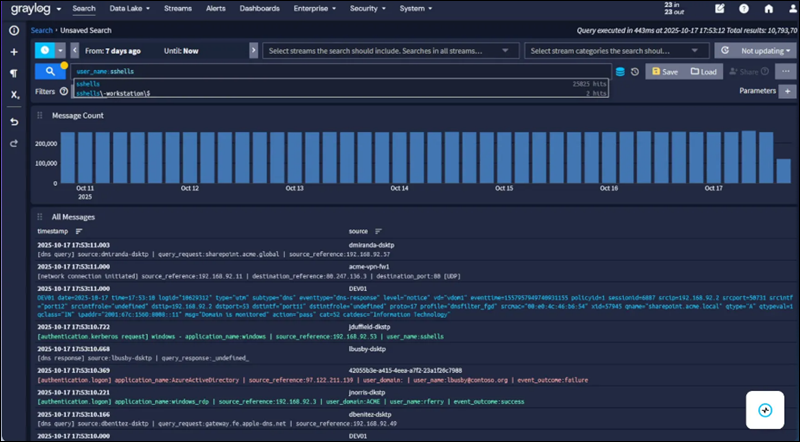
Graylog Enterprise is a centralized platform for managing logs. It works with common logging formats and inputs, and offers features like data tiering, advanced search, reporting, access controls, and alerts.
Graylog also has a separate Security edition for organizations that need more advanced SIEM features like threat detection.
Benefits
Graylog is an all-in-one tool. Its search tools make it easier to explore large amounts of log data and narrow down relevant events. Teams can quickly find answers from raw logs without needing to learn a complex query language.
After you fine-tune a search, you can save and reuse it later. You can also share saved searches with teammates, making handoffs smoother between operations, security, and support.
Drawbacks
The paid enterprise edition has a lot of features, and it's not really suited for smaller organizations that only need basic log collection and storage. Also, with a self-hosted deployments you would have to manage the underlying infrastructure yourself.
Cost/Pricing
Graylog Open is free and has no log-volume limit, but it includes fewer features than the paid versions. Graylog Enterprise starts at $15,000 per year and covers 10 GB of processed data per day or 100 Graylog Consumption Units for annual licensing.
Splunk Enterprise Security
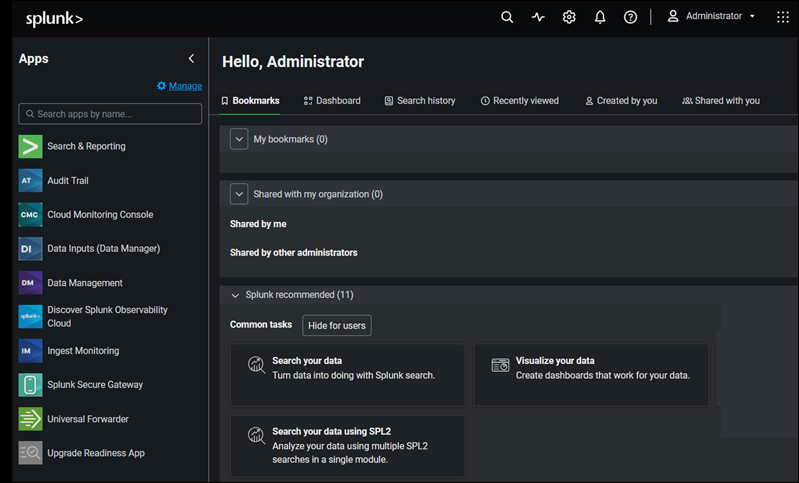
Splunk Enterprise Security is a SIEM platform that runs on Splunk Enterprise or Splunk Cloud Platform. It can collect and analyze records from different applications, operating systems, and infrastructure so teams can search activity and detect threats within the same environment.
Benefits
Splunk is mainly intended for large organizations and environments where teams need to correlate audit events with other security and operational data. The SIEM features allow users to detect threats, create alerts, and follow events across different systems.
Drawbacks
Splunk Enterprise Security offers much more than a basic auditing tool, which can make it too complex for organizations that just need to store and occasionally search audit records.
It can also become more expensive as the amount of data you collect grows.
Cost/Pricing
Splunk does not list a fixed price for Enterprise Security. The cost depends on how much data you process and which Splunk setup you use.
Fluentd / Fluent Bit (Open-Source Collector Pipeline)
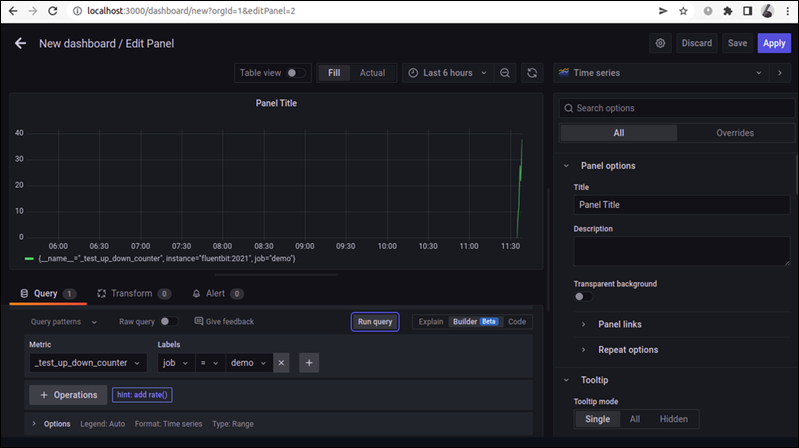
Fluentd and Fluent Bit work differently from the other tools here. They mainly collect and process data, instead of serving as full audit-log storage and analysis platforms.
Fluent Bit is a lightweight tool for collecting and forwarding data. Fluentd offers more plugins and greater processing power. Both can take in audit events, change or add to them, and send them to Elasticsearch, databases, object storage, or other logging solutions.
Benefits
Both tools are vendor-neutral and fit well as the collection layer in a distributed audit logging setup. Fluent Bit uses few resources and works on servers, containers, and edge devices. Fluentd offers hundreds of plugins to connect many data sources and destinations.
Drawbacks
Neither tool is a full audit logging platform on its own. You still need a place to store, search, protect, keep, and analyze the records they gather. So, using them often requires extra software and services.
Cost/Pricing
Fluentd and Fluent Bit are open-source projects under the Apache 2.0 license, so there are no software licensing fees.
Conclusion
You know how audit logging works, how it fits into automated workflows, and which tools are best for audit logging.
If you want to integrate audit logging into your deployment workflows, read our guide to Terraform configuration files. It explains how to define infrastructure and supporting services in Terraform.