Terraform automatically builds a dependency graph to determine how resources relate to one another and the order in which to perform infrastructure operations. The terraform graph command allows users to inspect that structure by generating graph data from a Terraform configuration or execution plan.
This article will explain how to use terraform graph, its syntax and options, troubleshooting tips, and best practices for visualizing Terraform dependencies.
What Is the terraform graph Command?
The terraform graph command generates a visual representation of a Terraform configuration or execution plan. Terraform produces the graph in the DOT language, which can then be processed with Graphviz or another compatible tool to create a visual diagram.
By default, the command generates a simplified graph showing the dependency ordering between the resource and data blocks in the configuration. Options such as -type generate more detailed graphs for specific operations, including planning, destroying infrastructure, and applying changes from a saved execution plan.
Note: phoenixNAP Bare Metal Cloud supports Infrastructure as Code workflows with tools such as Terraform, enabling automated provisioning and management of dedicated server infrastructure. Learn more about Infrastructure as a Code and the Bare Metal Cloud platform.
Understanding Infrastructure Visualizations in Terraform
Terraform builds and uses a dependency graph internally when performing infrastructure operations. The graph contains nodes that represent infrastructure components and other elements involved in an operation, while the connections between nodes represent dependency relationships. Terraform uses this information to determine which operations must occur before others.
The terraform graph command exposes this dependency information in DOT format. For example:
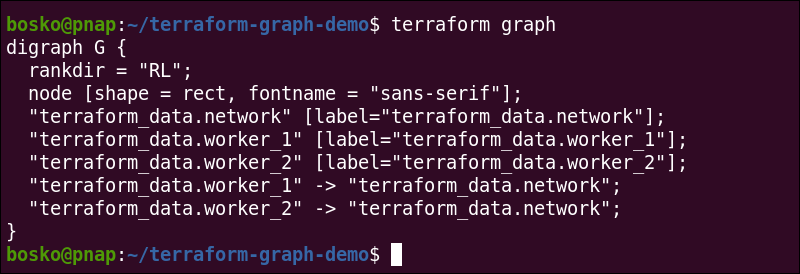
Although the output is not an image, you can pass it to Graphviz's dot command to render the graph as a PNG, SVG, or another supported format. For example, the following command generates a plan graph and renders it as a PNG file:
terraform graph -type=plan | dot -Tpng > graph.pngHashiCorp documents terraform graph as the command for generating graph data and Graphviz as the tool that renders that DOT output into an image.
Why Render a Dependency Graph?
A dependency graph provides a visual way to inspect relationships that are otherwise difficult to follow across multiple configuration files and modules. This option becomes extremely useful as Terraform configurations grow and infrastructure dependencies span compute, networking, data sources, providers, and reusable modules.
Rendering a graph helps users:
- Identify how resources depend on one another.
- Understand the dependency structure of a complex Terraform configuration.
- Inspect the relationships involved in a specific execution plan.
- Investigate circular dependency errors by highlighting cycles in operation graphs.
- Review module and resource relationships when troubleshooting configuration changes.
- Create visual documentation of infrastructure dependencies.
For example, a BMC deployment may contain Terraform resources and modules that manage dedicated servers alongside network and environment-specific configuration. Visualizing the dependency graph can make it easier to trace those relationships and understand the order Terraform uses when evaluating the infrastructure.
terraform graph: Syntax and Options
The terraform graph command accepts options that control the type of graph Terraform generates and how it evaluates input variables. The command writes the resulting graph in DOT format to standard output, allowing users to display it directly, save it to a file, or pipe it to another command for further processing.
The following sections explain the command syntax, available options, variable flags, global modifiers, and shell operators commonly used with terraform graph.
terraform graph Syntax
The command's basic syntax is:
terraform graph [options]The options are not mandatory. They modify the type of graph Terraform generates or provide additional input for graph generation. Add options when you need to inspect a specific operation, use a saved plan, or highlight dependency cycles.
When you run terraform graph without options, Terraform generates a simplified dependency graph that represents the relationships between resources and data sources in the current configuration. The command writes the graph data in DOT format to standard output.
For example:
terraform graphYou can redirect the output to a DOT file:
terraform graph > graph.dotAlternatively, pipe the output directly to Graphviz to render an image:
terraform graph | dot -Tsvg > graph.svgThe command does not require a positional argument. Use the available options to adjust graph generation behavior as needed.
Command-Specific Options
Terraform provides the following options specifically for the terraform graph command:
-plan=tfplangenerates a graph for applying the specified saved plan. This option implies-type=apply.-draw-cycleshighlights dependency cycles in the graph. This option is supported only with an operation graph selected using-type.-type=TYPEselects the operation graph to generate instead of the default simplified resource dependency graph. Supported values areplan,plan-refresh-only,plan-destroy, andapply.
For example, run the following command to generate a graph representing a plan operation:
terraform graph -type=planTo help diagnose circular dependencies, combine an operation graph with -draw-cycles:
terraform graph -type=plan -draw-cyclesOperation graphs provide more detail than the default output and may expose Terraform runtime implementation details. Use them when you need to inspect a specific operation or troubleshoot complex dependency behavior.
Positional Arguments
The terraform graph command does not accept positional arguments.
For example, Terraform does not support specifying a configuration directory after the command:
terraform graph ./productionTo run the command against a different Terraform working directory, use Terraform's global -chdir option before the graph subcommand instead:
terraform -chdir=./production graphThe -chdir option changes Terraform's working directory before it runs the selected subcommand.
Variable Flags
The terraform graph command supports the standard Terraform input variable options:
-var 'NAME=VALUE'sets a value for one root module input variable. Repeat the option to assign multiple variables.-var-file=FILENAMEloads root module input variable values from a .tfvars file. Repeat the option to load multiple variable files.
For example:
terraform graph -var 'environment=production'To load environment-specific values from a variable file, run:
terraform graph -var-file=production.tfvarsVariable values can affect how Terraform evaluates the configuration. Therefore, providing the appropriate variable values helps generate a graph that reflects the intended configuration for a specific environment.
Global Flags & Modifiers
Terraform global options must appear before the graph subcommand. The most relevant global modifier for this command is -chdir=DIR, which changes the working directory Terraform uses to locate the root module and related files.
For example:
terraform -chdir=./environments/production graphThis modifier is useful when running terraform graph from automation scripts or repository root directories without manually changing directories first.
You can also use Terraform's built-in help system to view command-specific usage information:
terraform graph -helpAvailable options vary between Terraform versions, so the built-in help output shows the options supported by the installed version.
Standard I/O Modifiers (Shell Operators)
Because terraform graph writes DOT data to standard output, shell operators are commonly used to save, redirect, or process the generated graph.
The following table summarizes the most useful syntax elements and options:
| Syntax or option | Description | Example |
|---|---|---|
-type=TYPE | Generates a graph for a specific operation type. Supported values include plan, plan-refresh-only, plan-destroy, and apply. | terraform graph -type=plan |
-plan=FILE | Generates a graph for applying a saved execution plan and implies -type=apply. | terraform graph -plan=tfplan |
-draw-cycles | Highlights dependency cycles when used with a supported operation graph. | terraform graph -type=plan -draw-cycles |
-var 'NAME=VALUE' | Sets a root module input variable. | terraform graph -var 'environment=production' |
-var-file=FILE | Loads root module variables from a variable file. | terraform graph -var-file=production.tfvars |
-chdir=DIR | Changes Terraform's working directory before running graph. This global option appears before the subcommand. | terraform -chdir=./production graph |
> | Redirects standard output to a file, replacing existing contents. | terraform graph > graph.dot |
>> | Appends standard output to a file. | terraform graph >> graphs.log |
| | Pipes DOT output to another command, such as Graphviz dot. | terraform graph | dot -Tpng > graph.png |
2> | Redirects standard error to a file. | terraform graph 2> errors.log |
2>&1 | Redirects standard error to the same destination as standard output. | terraform graph > output.log 2>&1 |
The Terraform-specific options control what graph the command generates, while shell operators control how the DOT output and any error messages are handled. This distinction is useful when building automated workflows that generate and render Terraform dependency graphs.
terraform graph Examples
The following examples use a Bare Metal Cloud (BMC) Terraform configuration to demonstrate different ways to generate and process dependency graphs. The examples assume Terraform is initialized in the working directory and that Graphviz is installed when rendering the DOT output into an image.
Basic Dependency Graph Generation for BMC Instances
Use terraform graph without additional options to generate the default dependency graph for the current configuration.
The following command writes the graph in DOT format to a file:
terraform graph > bmc-graph.dotFor a configuration that provisions BMC instances and supporting infrastructure, the output describes the dependency relationships Terraform identifies between the resources and data sources in the root module.
The following example uses the phoenixNAP Terraform provider to provision two Bare Metal Cloud servers:
terraform {
  required_providers {
    pnap = {
      source  = "phoenixnap/pnap"
      version = "0.33.0"
    }
  }
}

provider "pnap" {}

resource "pnap_server" "worker" {
  count        = 2
  hostname     = "worker-${count.index}"
  os           = "ubuntu/focal"
  type         = "s2.c1.medium"
  location     = "PHX"
  network_type = "PRIVATE_ONLY"
}

output "worker_ids" {
  value = pnap_server.worker[*].id
}
The pnap_server.worker resource uses count to create two BMC servers with incremented hostnames. Generate the dependency graph with:
terraform graph > bmc-graph.dotThe resulting file contains the graph in DOT format. You can inspect the resulting DOT file directly or render it with Graphviz:
dot -Tsvg bmc-graph.dot -o bmc-graph.svg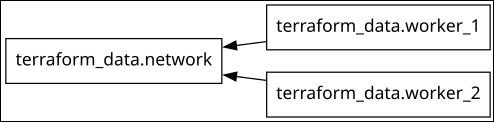
The resulting diagram provides a visual view of the dependencies Terraform derives from the configuration. In larger deployments, this can help identify how BMC compute resources connect to other resources, modules, and data sources.
Graphing Saved Execution Plans for Bare Metal Workloads
Use the -plan option to generate a graph from a saved Terraform execution plan. This is useful when you want to inspect the dependency structure of a specific planned operation, not just the configuration.
First, create and save a plan:
terraform plan -out=bmc.tfplanThen generate the graph:
terraform graph -plan=bmc.tfplan > bmc-plan.dotThe -plan option generates a graph for applying the specified plan and implies an apply-type graph.
Render the result with Graphviz:
dot -Tpng bmc-plan.dot -o bmc-plan.pngFor example, after modifying the BMC worker configuration, you can save the resulting plan and generate a graph from that exact plan. This lets you inspect the dependencies associated with the proposed infrastructure changes before applying them.
Detecting Circular Dependencies in BMC Network & Provisioning Logic
Terraform cannot create a valid execution order when resource dependencies form a cycle. When troubleshooting this type of error, generate an operation graph and use the -draw-cycles option to highlight cyclic dependencies.
For example, when investigating a dependency cycle in a more complex version of this setup, generate an operation graph with cycle highlighting:
terraform graph -type=plan -draw-cycles > cycles.dotThen, render the graph:
dot -Tsvg cycles.dot -o cycles.svgThe -draw-cycles option highlights dependency cycles in operation graphs, making it easier to identify the relationships that prevent Terraform from establishing a valid execution order.
For example, if BMC networking and server provisioning modules incorrectly depend on each other's outputs, the resulting cycle can prevent Terraform from creating the infrastructure. Review the references between the affected resources and modules and remove the dependency that creates the loop.
Avoid adding depends_on to work around a dependency error. Explicit dependencies add ordering constraints and do not resolve a cycle when resources already depend on one another in both directions.
Note: A dependency graph can help diagnose circular dependencies, but the configuration still requires changes to remove the cycle. Terraform must determine a valid dependency order before it can create or modify the affected infrastructure.
Rendering Environment-Specific Graphs via Variable Files
Use -var-file to provide environment-specific values when generating a graph. This option is useful when the same BMC configuration provisions servers with different settings for development, staging, or production.
For example, a variable file can define the server location and type:
location    = "PHX"
server_type = "s2.c1.medium"
Generate a graph using the production variables:
terraform graph -var-file=production.tfvars > production.dotRender the graph with Graphviz:
dot -Tsvg production.dot -o production.svgYou can also provide individual variables with -var:
terraform graph \
  -var='location=PHX' \
  -var='server_type=s2.c1.medium' \
  > production.dot
When input variables affect resource attributes or conditional configuration, providing the right values lets Terraform evaluate the configuration for the selected environment.
Isolating Specific BMC Hardware Modules via Piping
The terraform graph command writes DOT data to standard output, allowing you to pipe the result to other command-line tools.
For example, render the graph directly as an SVG without first creating a separate DOT file:
terraform graph | dot -Tsvg > bmc-architecture.svgThe command creates the DOT output and passes it directly to Graphviz's dot command.
You can also use shell tools to inspect the generated graph before rendering it. For example, search for references to a specific module with:
terraform graph | grep 'module.server'This can help locate references to a server module in a larger configuration.
However, text filtering does not create a valid isolated Terraform dependency graph. The grep command only extracts matching lines and can remove related nodes or edges required to represent the complete graph. Use this technique for inspection, not as a replacement for graph-aware filtering.
For a cleaner module-specific diagram, organize the BMC infrastructure into separate root modules or generate the graph from the relevant working directory.
Generating Architecture Diagrams in Targeted Working Directories
Use Terraform's global -chdir option to run terraform graph against a configuration in another working directory.
For example, organize the configuration into separate environment directories:
terraform-bmc/
├── modules/
│   └── server/
└── environments/
    ├── development/
    └── production/
The production directory can call the reusable server module while supplying production-specific values.
Generate the graph for the production configuration:
terraform -chdir=./environments/production graph > production.dotThen render the graph with Graphviz:
dot -Tpng production.dot -o production-architecture.pngYou can also pipe the graph directly to Graphviz:
terraform -chdir=./environments/production graph | \
dot -Tsvg > production-architecture.svg
Using -chdir is useful when a repository contains multiple Terraform root modules. It allows you to generate a graph for the selected BMC environment without changing the shell's current working directory.
terraform graph Common Problems
The terraform graph command can generate large and complex output, and problems may occur before or after Terraform produces the graph. Common issues include unreadable diagrams, missing Graphviz utilities, dependency cycles, incomplete graphs caused by configuration or planning errors, and differences between a planned operation and already deployed infrastructure.
The following sections explain how to identify and resolve these issues.
Handling Unreadable Output in Massive BMC Configurations
Large Terraform configurations can produce dependency graphs containing hundreds or thousands of nodes and edges. Rendering the entire graph as a single image may cause overlapping labels, long connection lines, and diagrams that are hard to interpret.
Instead of starting with the full graph, generate the graph in DOT format:
terraform graph > bmc-graph.dotThen, inspect the DOT file or render it as an SVG:
dot -Tsvg bmc-graph.dot -o bmc-graph.svgSVG is often more practical than a raster format for large graphs because you can zoom into individual sections without losing image quality.
For very large BMC configurations, also consider generating graphs from smaller root modules or environment-specific working directories instead of attempting to visualize the entire infrastructure repository at once:
terraform -chdir=./environments/production graph | \
dot -Tsvg > production-graph.svg
Splitting compute, networking, and other infrastructure into separate modules can also make individual dependency graphs easier to analyze.
Resolving Graphviz Installation and Rendering Errors
Terraform generates graph data in DOT format but does not render the output as an image. To create PNG, SVG, or other visual formats, you need a DOT-compatible rendering tool such as Graphviz.
For example:
terraform graph | dot -Tsvg > graph.svgIf the shell returns an error indicating that dot is not recognized or cannot be found, Graphviz is either not installed, or its executable isn't in the system PATH.
After installing Graphviz, verify that the dot command is available:
dot -VIf Terraform successfully produces a .dot file but Graphviz fails to render it, test the rendering step separately:
dot -Tsvg bmc-graph.dot -o bmc-graph.svgSeparating graph generation from rendering helps determine whether the problem originates in Terraform or in the Graphviz installation or rendering process.
Troubleshooting Circular Dependency Cycles in Hardware Provisioning
Terraform requires dependencies to form a valid order of operations. If resources or modules depend on one another in a cycle, Terraform cannot determine which operation to perform first.
When investigating a cycle, generate an operation graph with cycle highlighting enabled:
terraform graph -type=plan -draw-cycles > cycles.dotThen render the output:
dot -Tsvg cycles.dot -o cycles.svg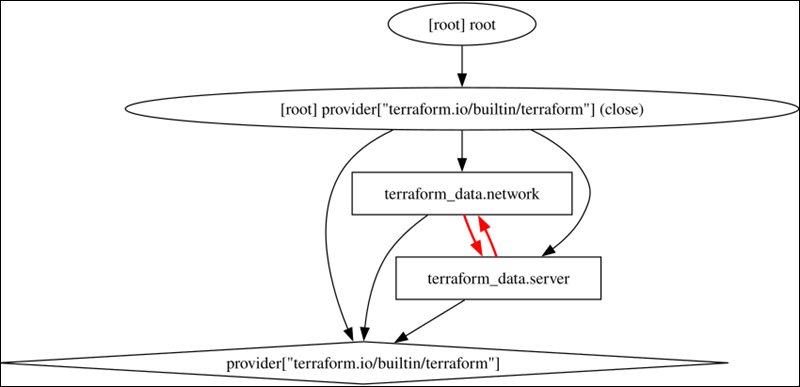
For example, a cycle can occur when BMC provisioning logic creates bidirectional dependencies between resources or modules. The problem may involve direct references or indirect references that pass through several resources.
Review the references connecting the affected resources and identify the dependency that creates the loop. In most cases, resolving the issue requires restructuring the configuration so one resource can be created without depending on an output that is available only after another resource depends on it.
Avoid adding depends_on to fix a cycle unless it removes an unnecessary relationship. Adding explicit dependencies can introduce additional ordering constraints and does not resolve an existing circular dependency.
Fixing Missing Resource Nodes in State vs. Code Execution
A generated graph may not always contain the resource nodes you expect. Before assuming that terraform graph has omitted infrastructure, verify the graph type you generated and whether the resource is part of the configuration or operation being analyzed.
The default terraform graph command generates a simplified graph based on the current configuration. It is not a direct visual representation of every object currently recorded in the Terraform state.
To analyze a specific planned operation, create and save an execution plan first using terraform plan:
terraform plan -out=bmc.tfplanThen generate a graph from that plan:
terraform graph -plan=bmc.tfplan > bmc-plan.dotThis lets you inspect the dependency structure for the saved apply operation.
If a resource exists in state but is no longer defined in the configuration, or if a resource does not participate in the graph type you selected, its absence from the output does not necessarily indicate data loss or an incorrect Terraform state. Use commands such as terraform state list to inspect the resources Terraform currently tracks in state.
Resolving terraform graph Execution Failures on Uninitialized Directories
Terraform commands that evaluate provider configuration, modules, or other initialized dependencies may fail when the working directory is not initialized.
If terraform graph cannot load the required configuration dependencies, initialize the directory first:
terraform initThen run the command again:
terraform graph > graph.dotWhen working with multiple BMC environments, ensure you initialize the specific root module before generating its graph:
terraform -chdir=./environments/production initThen, run this command:
terraform -chdir=./environments/production graph > production.dotInitialization downloads required providers and modules and prepares the working directory for Terraform operations.
Handling Discrepancies Between Planned Graph and Actual Applied State
A graph generated from a saved execution plan represents the dependency structure Terraform calculated for that specific planned operation. It does not guarantee that the graph will continue to represent the environment after subsequent configuration changes or additional Terraform operations.
For example:
terraform plan -out=bmc.tfplanNext, run:
terraform graph -plan=bmc.tfplan > bmc-plan.dotThe graph reflects the saved plan at the time it was created. If you later modify the BMC configuration, change input variable values, update provider settings, or create a new plan, the dependency structure for the next operation may differ.
Similarly, infrastructure can change outside of Terraform. If the deployed environment no longer matches Terraform's expected state, generate a new plan, and review the proposed changes:
terraform planUse the current configuration, state, and a newly generated plan when investigating differences between a previously generated graph and the infrastructure Terraform is currently managing. Avoid relying on an old graph when reviewing a changed environment or preparing a new infrastructure operation.
terraform graph Best Practices
Dependency graphs are most useful when they reflect the right Terraform configuration or operation and remain practical to inspect. A few simple practices can help avoid misleading graphs, unnecessary complexity, and difficulties when rendering or troubleshooting large BMC environments.
Follow these best practices to get more useful and maintainable dependency graphs from Terraform:
- Generate the graph from an initialized working directory. Run terraform init before generating graphs to ensure required providers and modules are available.
- Use the appropriate graph type. Use the default graph for a high-level view of resource dependencies and
-typewhen you need to inspect a specific Terraform operation. - Save complex graphs as DOT files first. Keep the raw output to make it easier to inspect, process, and render the graph with different Graphviz options.
- Use Graphviz for visual rendering. Treat
terraform graphas the graph-data generator and Graphviz as the rendering tool rather than expecting Terraform to produce an image directly. - Use
-draw-cycleswhen investigating dependency cycles. Combine it with an operation graph to make circular dependencies easier to identify. - Generate environment-specific graphs when appropriate. Use
-var-fileor-chdirto analyze the configuration and working directory associated with a particular BMC environment. - Keep large graphs manageable. Generate graphs for individual environments or smaller root modules when a complete infrastructure graph becomes too difficult to read.
- Use saved plans for operation-specific analysis. Generate a graph from a saved plan with
-planwhen you need to examine the dependencies associated with a particular planned apply operation. - Avoid treating a graph as a representation of deployed infrastructure. A Terraform graph describes configuration or operation dependencies; it is not an infrastructure topology diagram or a complete visualization of the resources currently running in BMC.
- Regenerate graphs after meaningful configuration changes. A graph can become outdated when resources, modules, variables, or dependencies change.
- Separate Terraform and Graphviz troubleshooting. If
terraform graphsucceeds but image rendering fails, inspect the Graphviz command and installation independently. - Use graphs as a troubleshooting and documentation aid. Combine dependency graphs with Terraform plans, state inspection, and configuration review rather than relying on the graph alone.
Conclusion
This article explained the terraform graph command, covered its syntax, options, practical BMC use cases, common problems, and best practices. By generating DOT output and using tools such as Graphviz for rendering, you can better understand resource relationships, investigate dependency cycles, and analyze complex infrastructure workflows.
Next, learn about the Terraform remote state, how it works, and when to use it.