Applications running in containers rarely stay in one place. Workloads automatically restart, move between machines, and scale up or down, so a failing component can disappear before anyone inspects it. Kubernetes monitoring gives operators continuous visibility into this shifting environment, from the cluster itself down to the applications it runs.
Traditional server monitoring focuses on fixed hosts that keep their names and roles. In Kubernetes clusters, workloads can be created, moved, or terminated within minutes, making static checks and per-host dashboards insufficient for tracking health and performance. This article explains what to monitor in a Kubernetes cluster, how the monitoring pipeline works, and how to set it up step by step.
What Is Kubernetes Monitoring?
Kubernetes is an open-source container orchestration platform that schedules containers across a group of machines, restarts them when they fail, and scales server workloads to match demand. Kubernetes monitoring is the practice of collecting and analyzing data about the cluster and everything running on it to detect problems and keep services healthy.
The practice covers the infrastructure (nodes and the control plane), the Kubernetes objects that run workloads (pods, deployments, services), and the applications inside the containers. Because these targets appear and disappear constantly, monitoring tools discover them through labels and the Kubernetes API instead of a fixed list of hosts. When a known problem occurs, such as a node running out of memory or pods failing to start, the tools send an alert.
Why Kubernetes Monitoring Matters
Monitoring lets operators verify a cluster's automated behavior and plan around it. Kubernetes restarts, reschedules, and scales workloads on its own, and the collected data shows whether those actions keep services running as intended.
The main reasons to monitor a Kubernetes environment are:
- Faster issue detection. Operators receive alerts about failing pods, saturated nodes, or rising error rates, often before end users notice a problem.
- Service reliability. Service level objectives (SLOs) define measurable performance and reliability targets, such as maximum response times, acceptable error rates, or minimum availability. Monitoring these metrics against SLOs helps teams identify service degradation and maintain reliable, highly available applications.
- Capacity planning. Monitoring resource trends helps operators anticipate shortages in processing power or memory and scale clusters before resource constraints affect workload performance.
- Cost control. Comparing resource requests with actual usage exposes overprovisioned workloads and idle nodes.
- Security and audit visibility. Security teams can detect unauthorized access and misconfigurations through Kubernetes API audit logs and unexpected changes in workload behavior.
Monitoring data allows engineers to troubleshoot faster and reduce downtime. During an incident, they can examine historical metrics and logs to identify when problems began, trace changes in system behavior, and investigate potential causes.
Kubernetes Monitoring vs. Observability
Monitoring and observability are closely related, but serve different purposes. Monitoring tracks predefined metrics and alerts when a value crosses an established threshold, helping to identify known issues, such as a node running low on memory. Observability provides an understanding of a system's internal state from the data it produces, so engineers can investigate unexpected issues and identify their underlying causes.
The following table compares the two approaches:
| Aspect | Monitoring | Observability |
| Main Purpose | Detecting that something is wrong. | Explaining why something went wrong. |
| Approach | Predefined metrics, dashboards, and alerts. | Correlating metrics, logs, and traces across services. |
| Best For | Known failure modes. | New or unexpected failure modes. |
| Typical Output | Alerts and status views. | Root cause analysis. |
In practice, monitoring and observability work together. Monitoring alerts teams to known issues, while observability provides the context needed to investigate their causes, including unexpected failures. Kubernetes teams typically use metrics, logs, and traces together to detect problems, understand system behavior, and troubleshoot more effectively.
What to Monitor in Kubernetes
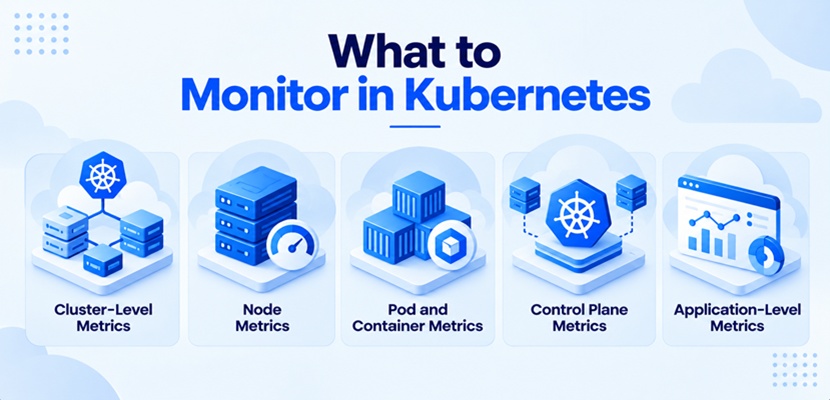
A Kubernetes cluster consists of a control plane and worker nodes, and workloads run in pods on top of them. A problem in one layer often shows up as a symptom in another, so monitoring each layer separately makes it easier to trace a symptom back to its source.
Cluster-Level Metrics
Cluster-level metrics show the overall health and capacity of the environment. They include the number of ready and not-ready nodes, total resource requests compared with allocatable capacity, and the number of pods in each phase (running, pending, or failed).
A growing number of pending pods signals that the scheduler cannot find room for new workloads. Nodes marked as not ready point to hardware, network, or node agent (kubelet) problems.
Node Metrics
Each node is a physical or virtual machine that runs pods. Node metrics show whether the machine has enough resources for its workloads and whether the operating system is healthy.
Key node metrics include:
- CPU usage. Sustained high usage can slow down every pod on the node.
- Memory usage. Nodes under memory pressure evict pods to free resources.
- Disk usage and I/O. Full disks block container image pulls and log writes.
- Network throughput and errors. Dropped packets and saturated bandwidth increase network latency between services.
Kubernetes also reports node conditions such as MemoryPressure and DiskPressure, and these conditions work well as alert triggers.
Pod and Container Metrics
Pods are the smallest deployable units in Kubernetes, and each pod holds one or more containers. Pod and container metrics show whether workloads run as intended and stay within their resource limits.
Important signals include:
- Restart count. Frequent restarts point to crashing applications or failing health checks.
- Usage vs. requests and limits. Requests set the resources a container is guaranteed, while limits cap the maximum it can use. Containers that exceed their memory limit are terminated, and containers that reach their CPU limit are throttled.
- Pod status. Pods stuck in states such as
Pending,CrashLoopBackOff, orImagePullBackOffneed attention. - Replica availability. Replicas are identical copies of a pod that run the same workload. A gap between the desired and available number of replicas shows that a deployment is not running at full capacity.
Comparing usage with requests also helps with rightsizing, the practice of matching resource requests to what workloads actually use. Excessive requests reduce the capacity available for scheduling other pods, even when actual usage is low.
Control Plane Metrics
The control plane is the set of components that manages the cluster. It makes scheduling decisions, stores the desired state of the cluster, and reacts to changes. When it slows down, running workloads continue, but new deployments, scaling actions, and recoveries stall.
Its four main components, and the metrics that show their health, are:
- API server. Handles every request to the cluster; its core metrics are request latency and error rates.
- etcd. Stores all cluster data, including configuration and the state of every object, in a distributed key-value database. Database size and disk write latency show whether etcd is keeping up with the cluster.
- Scheduler. Assigns new pods to nodes, and scheduling latency shows how quickly that happens.
- Controller manager. Runs the control loops that keep the cluster's actual state in line with the desired state (e.g., by replacing a failed pod). A growing backlog in its work queues shows that controllers cannot keep up with changes.
Slow API responses often affect the other three components as well, since the scheduler, the controllers, and etcd all communicate through the API server.
Application-Level Metrics
Applications are the reason a cluster exists, and their metrics show what users experience. Application monitoring relies on metrics the application exposes itself, beyond what Kubernetes reports about its containers.
Most services can be measured with four signals, known as the four golden signals:
- Latency. Measures how long the service takes to respond to a request.
- Traffic. Measures how much demand the service receives (e.g., requests per second).
- Errors. Measures how often requests fail.
- Saturation. Measures how close the service is to the limits of its resources.
Synthetic checks extend this view to the user's side by sending scripted test requests from outside the cluster, while real user monitoring records the response times that actual visitors experience.
How Does Kubernetes Monitoring Work?
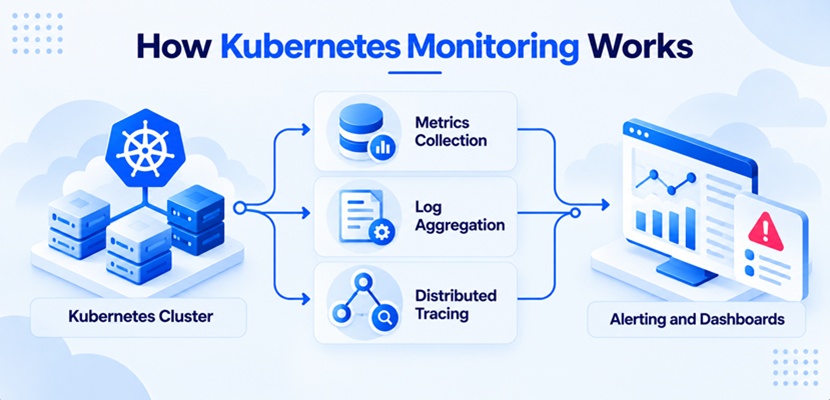
Monitoring Kubernetes relies on a pipeline that gathers data from many sources inside the cluster, stores it centrally, and turns it into dashboards and alerts. Most of the components are open-source projects that run inside the cluster as regular workloads.
Metrics Collection
Kubernetes components expose metrics over HTTP endpoints in a standard text format. Prometheus, the most widely used open-source monitoring system for Kubernetes, scrapes these endpoints at regular intervals. It stores the results in a time series database, which records each metric as a sequence of values over time.
The main metric sources are:
- kubelet. Reports CPU, memory, file system, and network usage for every container on the node through its built-in cAdvisor (Container Advisor) component.
- Node exporter. Exposes operating system and hardware metrics, such as disk and network activity, from each node.
- kube-state-metrics. Converts the state of Kubernetes objects into metrics, such as desired and available replicas or pod phases.
- Control plane components. Expose their own metrics about request handling, scheduling, controller activity, and etcd health.
Stored metrics can be queried, graphed, and compared over time to reveal trends, such as slowly increasing memory usage that could eventually exhaust a node’s available memory.
Note: Kubernetes also offers an add-on called Metrics Server, which is easy to confuse with a monitoring system. It collects short-term CPU and memory readings for autoscaling and the kubectl top command but keeps no history, so it cannot replace the sources above.
Log Aggregation
Containers write logs to standard output and standard error, and the container runtime stores them as files on the node. These files disappear when a pod is deleted or its node fails, so logs must be moved elsewhere to remain available.
A log agent runs on every node as a DaemonSet, a Kubernetes object that places one copy of a pod on each node. The agent reads the log files, adds metadata (such as the pod name and namespace) and forwards the entries to a central backend for search and log analysis. Kubernetes events also provide valuable diagnostic information, such as failed pod scheduling attempts. Because the Kubernetes API server retains events for a limited time, an event exporter forwards them to the logging backend for long-term storage and analysis.
Distributed Tracing
A single user request often passes through several microservices, and tracing follows that request across every service it interacts with. Each service records its part of the request as a span, and the tracing system joins these spans into one timeline.
OpenTelemetry is an open-source vendor-neutral framework for generating, collecting, and exporting telemetry data, including metrics, logs, and traces. It has become the standard method of adding tracing to applications. Each service sends its spans to the OpenTelemetry Collector, which processes them and forwards them to a tracing backend. The Collector runs as a DaemonSet on each node as a standalone service, or as a sidecar container alongside the application in the same pod.
Alerting and Dashboards
Alerting rules continuously evaluate metrics and trigger an alert when a condition lasts for a set period, such as a node staying above a memory threshold for several minutes. An alert manager groups related alerts, removes duplicates, and routes notifications to the right on-call engineer through email, chat, or paging tools.
Dashboards present the same data visually. They show cluster health at a glance and let engineers drill down from the cluster view to a single pod during an incident.
Kubernetes Monitoring Challenges
The automation that makes Kubernetes efficient also makes it hard to observe. Workloads change constantly, data volumes grow with every new service, and parts of the stack can sit outside the operator's reach.
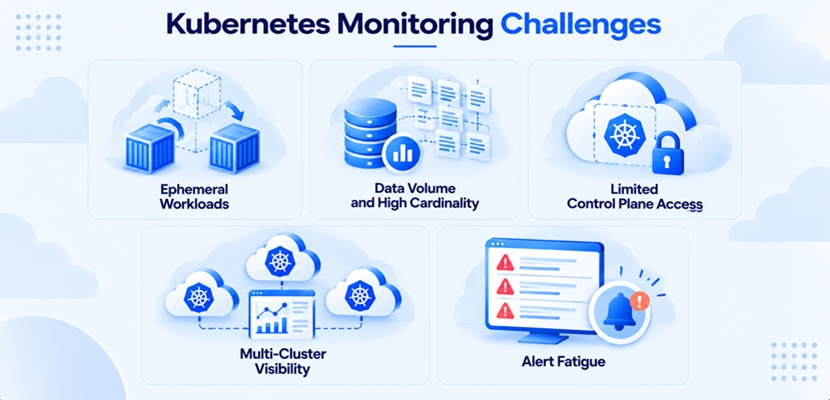
The most common challenges include:
- Ephemeral workloads. Pods can be replaced within seconds, and their local logs and recent metrics disappear with them before anyone can investigate.
- Data volume and high cardinality. Cardinality is the number of unique time series a system stores, and every unique combination of label values creates a new one. Labels such as pod names multiply quickly as pods are replaced, driving up storage and query costs.
- Limited control plane access. Managed Kubernetes services operate the control plane on the customer's behalf and expose only part of its metrics and logs.
- Multi-cluster visibility. Organizations that run clusters across multi-cloud and hybrid cloud environments need one view instead of separate tools per cluster.
- Alert fatigue. Too many low-priority or duplicate alerts tend to train engineers to ignore notifications, including the important ones.
These challenges grow with the environment. A small cluster in a test environment hides most of them, while a production environment with many namespaces and frequent deployments can experience several simultaneously.
Note: Running Kubernetes on phoenixNAP's Bare Metal Cloud, a dedicated server with the flexibility of the cloud, gives full access to the control plane and the underlying hardware, so every metric source stays within reach. Deploy a cluster in one click with Rancher on Bare Metal Cloud, or install Kubernetes on a bare metal server and roll out monitoring agents consistently with BMC automation tools.
Kubernetes Monitoring Tools
Most monitoring stacks either combine several open-source projects, each handling one part of the pipeline, or rely on a commercial platform that bundles them. The right mix depends on cluster size, in-house expertise, and how much of the stack an organization wants to operate itself.
Widely used options include:
- Prometheus. Collects and stores metrics and evaluates alerting rules, with the Prometheus Operator managing it natively in Kubernetes.
- Grafana. Visualizes monitoring data in dashboards and supports alerting.
- OpenTelemetry Collector. Receives, processes, and exports telemetry in a vendor-neutral format.
- Fluent Bit. Collects container logs on every node and forwards them to a log backend.
- Grafana Loki. Stores logs and indexes them by label, matching the label model used for metrics.
- Jaeger. Stores and visualizes distributed traces.
- Thanos. Adds long-term storage and a global query view across multiple Prometheus instances.
- Commercial platforms. Combine every signal type and alerting in one hosted service (e.g., Datadog, New Relic, Dynatrace, Elastic Observability).
- Kubernetes platforms with built-in monitoring. Ship a preconfigured monitoring stack with the distribution (e.g., Rancher and OpenShift).
Managed Kubernetes services also include their own monitoring add-ons. Monitoring is one category of Kubernetes tools, alongside management, security, and cost control.
Kubernetes Monitoring Best Practices
Clusters gain namespaces, services, and nodes over time, and a monitoring setup that worked at first can become noisy or incomplete. Operators who regularly review the setup keep the data consistent, the alerts meaningful, and the telemetry secure.
The following practices apply to most Kubernetes environments:
- Apply consistent labels. Shared labels for application, environment, and owner make it possible to filter and correlate data across sources.
- Alert on symptoms, not causes. Alerts tied to SLOs, such as rising error rates or latency, reflect user impact. Signals that only point to a possible cause, such as high CPU usage, belong on dashboards.
- Control cardinality and retention. Labels with unbounded values, such as user IDs, inflate data storage. Detailed data is kept for a short period, while long-term trends are stored at lower resolution, with fewer data points per time range.
- Monitor the monitoring stack. Collectors and backends need their own health checks and enough resources to keep running during cluster-wide problems.
- Keep secrets out of telemetry. Logs and traces can capture passwords, API keys, or personal data, turning monitoring data into a source of data leaks.
- Restrict access with role-based access control (RBAC). Telemetry reveals internal service details, so dashboard and query access follows the principle of least privilege.
- Review alerts regularly. Alerts that nobody acts on add noise and should be removed or turned into dashboard panels.
General Kubernetes best practices, such as setting resource requests and health probes, also improve monitoring. Well-defined workloads produce cleaner and more predictable data.
Getting Started with Kubernetes Monitoring
A complete monitoring setup does not have to be built at once. Starting with metrics and adding logs and traces in stages keeps the effort manageable and delivers useful alerts early.
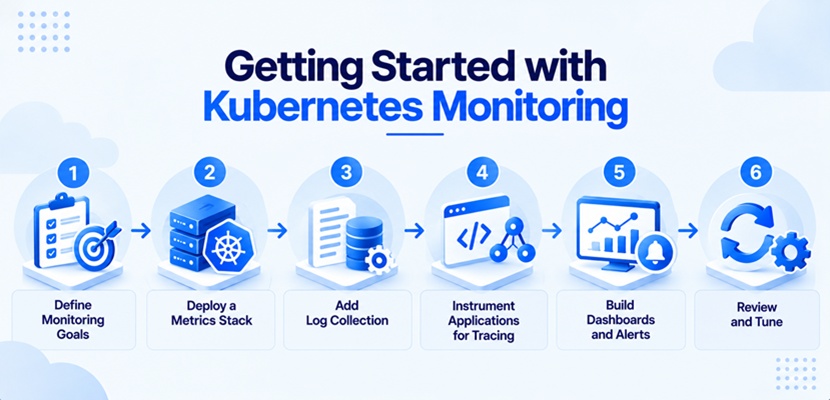
1. Define Monitoring Goals
List the services that matter most. Define what healthy means for each one by setting SLOs for availability and latency. Assign an owner to receive the alerts for each service. Use these goals to choose the first metrics and alerts.
2. Deploy a Metrics Stack
Install Helm, the package manager for Kubernetes. Use its kube-prometheus-stack chart to deploy Prometheus on Kubernetes. The chart installs the main components of the metrics pipeline in one release, including prebuilt dashboards and alerting rules. Before moving on, confirm that node, pod, and control plane metrics appear.
3. Add Log Collection
Deploy a log agent as a DaemonSet that sends logs to a central backend. Add an event exporter to the same pipeline so scheduling and image pull errors appear next to application logs.
4. Instrument Applications for Tracing
Add OpenTelemetry instrumentation (the code that records spans) to the services that handle user requests. Where the programming language supports it, start with automatic instrumentation. Deploy the OpenTelemetry Collector to forward spans to a tracing backend.
5. Build Dashboards and Alerts
Use the prebuilt Prometheus and Grafana dashboards as a starting point, adapting them to the goals from step one. Configure baseline alerts for node pressure, repeated pod restarts, and SLO breaches. Route each alert to the owner defined in step one.
6. Review and Tune
After the first few weeks of operation, review alerts and dashboards. Remove alerts nobody acts on. Add the metrics that recent incidents showed were missing. Manage monitoring configuration as infrastructure as code, with changes deployed through the CI/CD pipeline like any other code. Watch dashboards closely during rolling updates, when new versions are most likely to introduce errors.
Kubernetes Monitoring FAQ
Organizations setting up Kubernetes monitoring for the first time tend to ask the same questions about tools, metrics, and scope. Most of these questions come up during planning, before the first component is deployed, and the answers shape the rest of the setup.
What Is the Best Tool for Monitoring Kubernetes?
No single tool is best for every environment. The most common open-source stack pairs Prometheus for metrics and Grafana for dashboards, adding a log backend and OpenTelemetry for traces. Commercial platforms bundle these functions into one hosted service.
What Are the Most Important Kubernetes Metrics to Monitor?
Start with node resource usage, pod restarts and status, and API server latency and errors. For applications, track the four golden signals (latency, traffic, errors, and saturation), which show what users experience.
Is Prometheus Enough for Kubernetes Monitoring?
No, not on its own. Prometheus handles metrics and alerting well, but it does not collect logs or traces, and a single instance offers limited long-term storage and no view across clusters. For comprehensive Kubernetes observability, production environments typically combine Prometheus with centralized logging, distributed tracing, and long-term metrics storage solutions such as Thanos.
Turning Kubernetes Signals into Action
Kubernetes monitoring turns a constantly changing environment into something operators can see, measure, and trust. With every layer of the cluster reporting to one place, problems surface early and leave enough context to fix them quickly. Start small: deploy a metrics stack, define SLOs for your most important service, and add logs and traces once the first alerts prove useful.