The Docker engine runs application components inside isolated user-space environments called containers.
Containers draw compute, memory, and storage access directly from the host kernel, making resource monitoring a priority for a Docker system.
This article will explain the docker stats command and provide advice on using it to control container resource usage.
What Is the docker stats Command?
The docker stats command is a CLI-based diagnostic tool for monitoring container resource usage. The tool outputs continuous live metrics covering CPU consumption, memory footprints, network I/O, and block I/O operations.
Unlike standard Linux system monitors like top or htop that inspect host-level process trees, docker stats targets container control groups (cgroups) directly.
The Docker daemon queries cgroups to calculate resource usage for active workloads. It then outputs data containing the following resource metrics:
| Metric | Description |
|---|---|
CONTAINER ID / NAME | The unique hexadecimal identifier and human-readable string assigned to the target container. |
CPU % | The percentage of host CPU capacity currently consumed by container processes. |
MEM USAGE / LIMIT | The current memory footprint and the total memory allocation limit enforced on the container. |
MEM % | The percentage of container memory allowance actively used by running processes. |
NET I/O | Total volume of data received and transmitted over the container network interface. |
BLOCK I/O | Total volume of read and write operations written to persistent host disk storage. |
PIDS | The total count of active tasks or process threads running inside the container space. |
docker stats vs. docker top
The docker top command exposes the active process tree in a specific target container. It outputs standard Unix process attributes, including Process ID (PID), User ID (UID), and CPU execution time. Use the command to identify specific frozen worker threads or rogue sub-processes inside a container instance.
The docker stats command measures live resource usage rates across container boundaries. Use docker stats when analyzing overall resource consumption, host memory allocation limits, or network bandwidth spikes across single or multiple container groups.
How Does docker stats Work?
The docker stats architecture relies on the underlying Linux kernel isolation mechanisms rather than internal container agents. The Docker daemon is an intermediary that collects and formats raw operational metrics.
When executed, docker stats sends a request to the Docker Engine daemon API over the Unix socket (/var/run/docker.sock). The daemon reads control group files located within the host pseudo-filesystem (typically /sys/fs/cgroup/) corresponding to each active container runtime identifier.
The command uses the following mechanisms to produce a report:
- For memory tracking, the daemon reads memory.usage_in_bytes or memory.current depending on whether the host operates cgroups v1 or v2.
- For CPU metrics, the daemon calculates ticks consumed within cpu.stat relative to total system CPU time elapsed between sampling intervals.
- Network and block metrics originate from kernel virtual network interface drivers and block device IO counters. The daemon packages these raw measurements into a JSON stream and transmits the data to the client for continuous terminal rendering.
docker stats Syntax
The standard syntax for executing the docker stats command follows Docker CLI conventions:
docker stats [options] [container_name_or_id]To inspect multiple containers at once, list them one after another in the same command:
docker stats [options] [container1_name_or_id] [container2_name_or_id] [...]To view all the containers, enter only the command and any necessary options:
docker stats [options]docker stats Options
Flags appended to the base command modify output, apply formatting templates, or select specific container targeting criteria. The table below lists the available docker stats options:
| Option | Description |
|---|---|
--all, -a | Display statistics for all containers, including stopped and exited containers. |
--format | Format output layout using custom Go templates or string key mappings. |
--no-stream | Disable continuous metric streaming and print a single current snapshot. |
--no-trunc | Disable truncation of container IDs or long names in terminal display output. |
docker stats Examples
Use docker stats to inspect, filter, and export live container resource data. The following examples show common operational tasks.
Display Real-Time Stream for All Active Containers
Executing the base command without additional flags starts a monitoring feed. The terminal screen updates automatically every second to display dynamic resource changes.
docker stats
View Stats for Specific Containers by Name or ID
Isolate specific containers by appending names or unique hexadecimal identifiers directly after the command:
docker stats web_nginx cache_redis
Get a Single Snapshot Without Streaming (--no-stream)
Automated shell scripts require metrics without hanging command prompt threads indefinitely. Add the --no-stream flag to capture current metrics, output a single text table, and terminate execution immediately:
docker stats --no-stream
The --no-stream flag allows integration into custom bash reporting loops, log shippers, or cron jobs.
Format docker stats Output Using Go Templates (--format)
Standard outputs include fields that administrators often need to reformat, restrict, or align differently. The --format option applies Go template syntax to structure output streams.
Use the following command to print container names alongside CPU utilization in clean key-value format:
docker stats --format "Container: {{.Name}} | CPU: {{.CPUPerc}} | Mem: {{.MemUsage}}"
Display All Containers Including Stopped Ones (--all)
By default, the command ignores non-running containers. The --all (or -a) option forces inclusion of stopped containers:
docker stats --all --no-stream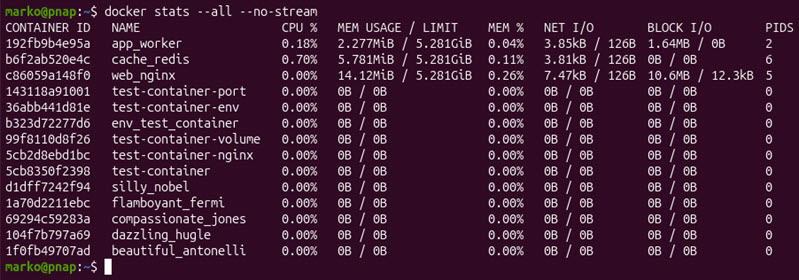
Export Container Statistics to JSON or CSV Format
Structured formats let secondary analytics engines use container metrics. Go template formatting converts standard terminal outputs into structured data objects.
Type the following command to output real-time container stats as valid JSON lines:
docker stats --no-stream --format '{"container":"{{.Name}}","cpu":"{{.CPUPerc}}","memory":"{{.MemUsage}}"}'
Use the syntax below to output stats as Comma-Separated Values (CSV) suitable for database ingestion:
docker stats --no-stream --format "{{.Name}},{{.CPUPerc}},{{.MemUsage}},{{.NetIO}}" > container_stats.csvFilter and Sort Container Performance Data
Combining the Docker CLI with standard Unix text-processing pipelines enables filtering and sorting. For example, to sort containers by memory footprint in descending order, use:
docker stats --no-stream --format "table {{.Name}}\t{{.MemUsage}}\t{{.CPUPerc}}" | sort -k2 -hr
The example below uses the awk command to show instances exceeding CPU thresholds:
docker stats --no-stream | awk 'NR>1 && $3 != "0.00%" {print $2, $3}'
docker stats Common Problems
Some edge use cases can produce unexpected behavior, metric discrepancies, or command failures. The following sections list common problems and provide troubleshooting tips.
High CPU Usage and Overhead from Continuous Streaming
Continuous monitoring across hundreds of running containers creates processing overhead on the host. The Docker daemon must calculate cgroup changes perpetually for each registered instance.
Avoid leaving background terminal sessions running unmonitored streams on production hosts. Utilize polling intervals via shell loops with --no-stream or use dedicated telemetry collectors (such as Prometheus exporters) for large deployments.
Incorrect or Misleading Memory Usage (Cache vs. RSS)
Since cgroup metric calculations treat cached pages differently than standard system utilities, comparing docker stats memory figures with host-level commands like free or top may show discrepancies.
Docker calculates memory consumption using the formula:
[memory_consumption] = [total_memory_usage] - [page_cache]On cgroup v1 systems, Linux page cache allocations may linger in cgroup statistics, inflating reported figures until the host reclaims inactive pages. Modern cgroup v2 implementations present cleaner metrics, but file-backed caching still causes discrepancies.
Treat memory metrics as estimates, and cross-reference container internal metrics using tools like free -m inside the target environment.
Stats Output Truncation in Limited Terminal Windows
Column layout adjustments prevent awkward text wrapping on small screens. However, narrow terminal viewports may truncate important resource strings.
Resolve layout wrapping issues by maximizing terminal windows, passing the --no-trunc flag to force full string display, or applying selective --format templates to print only pertinent fields.
Unavailable or Zeroed Stats for Stopped Containers
When containers enter the exited or stopped state, the Linux kernel destroys the associated control group hierarchy. Consequently, the Docker daemon loses access to live CPU, RAM, and IO metrics.
Running docker stats --all against stopped containers displays 0.00% CPU usage, 0B / 0B memory utilization, and empty thread counts.
To resolve this, retrieve historical performance records for terminated instances via centralized log management platforms or persistent APM agents.
Permission Denied Errors Accessing Docker Socket
Non-root users can encounter the permission denied error when using the docker stats command. Socket protection settings restrict unprivileged API access across system accounts.
To resolve the issue, add target system users to the security group using:
sudo usermod -aG docker [username]Inaccurate Network I/O Metrics in Custom Drivers or Host Mode
Containers configured with --net=host bypass dedicated network namespaces entirely and directly share the host network stack. Because host-mode container interfaces lack isolated virtual Ethernet pairs (veth), the Docker daemon cannot distinguish container-specific packets from total host traffic and reports zero-byte transfers.
If strict host networking is not required, resolve the issue by switching the container to a user-defined bridge network. Otherwise, consider using process-aware monitoring tools (e.g., nethogs).
Conclusion
This guide helped you understand how to use the docker stats command to extract real-time container metrics, format command-line outputs, and diagnose common runtime monitoring issues. The article provided technical details about the command, along with CLI examples and solutions to common performance telemetry problems.
Next, read our recommendations on how to optimize Docker image size.